


EDUCATION
Admissions Conversion Rate 101: The Complete Guide to Boosting Enrollment
Contents
The United States is predicted to have 3.1% fewer high school graduates in 2030 than in 2023. An increase in non-traditional, adult learners is reflected in the fact that 37% of undergraduate students are now over 25. Many of these students balance full-time or part-time work, creating a demand for flexible, accessible learning options.
As a result, colleges and universities today face challenges never seen before. As the conventional college-age population declines due to demographic shifts, fewer people are applying to many institutions. Meanwhile, online universities and other alternative education providers are intensifying competition in an already crowded digital market. Perhaps most concerning, however, is the increasing student attrition across the admissions funnel—from inquiry to application, application to acceptance, and acceptance to enrollment.
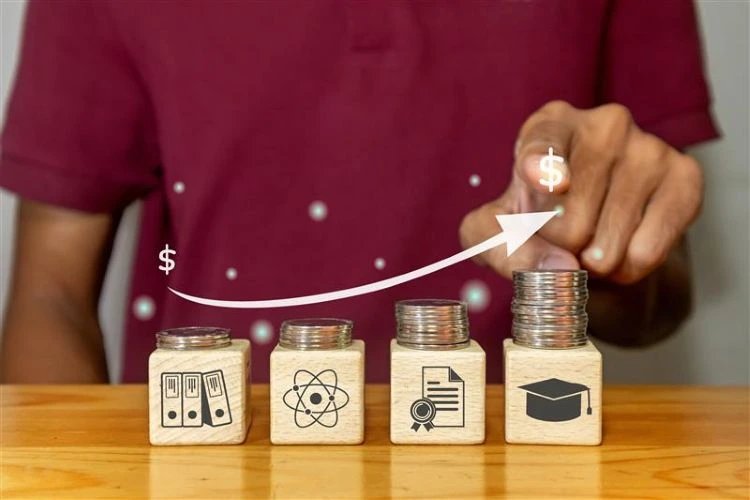
In this environment, it has never been more critical to turn potential students into enrolled ones. Important performance metrics such as admissions conversion rates and enrollment conversion rates reveal how effectively your school guides students from initial inquiry to final matriculation. But, success today takes more than just filling seats -it entails creating a data-driven enrollment strategy that attracts the right students, nurtures them through personalized engagement, and converts their interest into long-term commitment.
Factors like the admissions conversion rate are important because they directly influence your university’s long-term growth, academic diversity, and financial stability. A high admission conversion rate indicates that students find value in your institution and the experiences or information you’ve shared with them, that your marketing resources are being used effectively, and that your admissions team is successfully engaging with prospective students.
The admission conversion rate measures how effectively prospective students move through your enrollment process, typically tracking how many admitted applicants go on to enroll.
It is simple:

The enrollment process isn’t linear, though, and organizations should monitor conversion rates at various points to see where potential students lose interest.
Formula: (Number of applications submitted ÷ Total number of inquiries) × 100
Formula: (Number of enrolled students ÷ Number of admitted students) × 100
Let’s go over a real-world illustration. During their recruitment round, Imagine State University received 5,000 queries. Of those:
The overall enrollment conversion rate from inquiry to enrollment would be: (450 ÷ 5,000) × 100 = 9%
This means that just nine of every 100 students who expressed interest actually enrolled. By examining conversion rates at every stage, State University can identify specific bottlenecks. For instance, even though their inquiry-to-application rate is strong, their yield rate might need to be increased.
Knowing how to compute the enrollment conversion rate at each stage of the funnel helps admissions staff to apply targeted interventions rather than broad solutions.

While these terms are often used interchangeably, understanding the nuanced difference between admission and enrollment conversion rate helps institutions communicate more precisely about their metrics.
The appropriate metric depends on your institution type and strategic focus:
| Metric | What It Measures | Best For |
| Admission Conversion Rate | Applicants offered admission | Measuring selectivity standards |
| Enrollment Conversion Rate | Admitted students who enroll | Assessing competitive positioning |
| Overall Funnel Conversion | Inquiries that become enrollments | Evaluating end-to-end efficiency |
If you’re wondering why my college admission conversion rate is low, you’re not alone. Many institutions struggle with conversion challenges stemming from operational inefficiencies, communication gaps, or misaligned strategies.
Speed matters tremendously in admissions. Institutions that respond to inquiries within five minutes are significantly more likely to engage prospects than those that wait even an hour. When admissions counselors take days to follow up—or fail to follow up at all—interested students move on to more responsive institutions.
Today’s students expect personalized experiences. Generic email blasts that don’t acknowledge a student’s specific interests, academic goals, or program preferences feel impersonal and irrelevant. When communications don’t resonate, engagement drops and conversion rates suffer.
Many institutions still rely on disconnected systems where marketing captures leads in one platform, admissions team tracks applicants in another, and enrollment uses a third system. This fragmentation creates blind spots, duplicated efforts, and missed opportunities to engage students at critical moments.
When marketing and admissions operate in silos, problems multiply. Marketing might generate high volumes of low-quality leads that admissions can’t convert. Or admissions might not provide feedback that helps marketing refine targeting and messaging. Without alignment, even strong individual efforts fail to optimize the overall enrollment conversion rate.
Improving your enrollment conversion rate requires strategic interventions across technology, processes, and team alignment. Here are proven strategies to increase enrollment conversion rates that deliver measurable results.
Manual lead management simply can’t compete with automation in today’s fast-paced enrollment environment. Implementing a robust CRM system allows institutions to capture leads instantly from multiple sources—website forms, events, paid ads, virtual tours—and trigger immediate automated responses.
Automated workflows ensure no inquiry falls through the cracks. When a student submits an inquiry at 11 PM on Saturday, they receive an immediate acknowledgment email and are automatically assigned to a counselor for Monday follow-up. This combination of instant response and systematic follow-through dramatically improves conversion rates.
Personalization at scale becomes possible with modern marketing automation tools. Dynamic email content adapts based on student attributes—prospective major, geographic location, academic interests, or engagement behavior.
AI-powered chatbots provide instant, personalized responses to common questions 24/7. Students researching programs at midnight get immediate answers about admissions requirements, financial aid, or campus life—rather than waiting for business hours. This always-on engagement keeps prospects moving forward rather than losing momentum.
You can’t improve what you don’t measure. Comprehensive analytics dashboards should display real-time conversion metrics across your entire enrollment funnel.
These insights enable data-driven decision-making. Instead of guessing which strategies work, you can allocate resources based on actual performance data and continuously optimize your approach.
Not every prospective student is ready to apply immediately. Automated nurturing workflows keep your institution top-of-mind for students still in the research phase. Triggered email sequences deliver valuable content—program information, student success stories, financial aid guidance—at strategic intervals.
Re-engagement campaigns target students who showed initial interest but haven’t progressed. A well-timed reminder about application deadlines, coupled with an offer to discuss questions with a counselor, can reactivate dormant prospects and improve overall conversion rates.
Complex, lengthy applications create unnecessary barriers to enrollment. Many prospective students begin applications on mobile devices during commutes or breaks. If your application isn’t mobile-optimized, you’re losing conversions.
Simplify application forms by requesting only essential information upfront. Use progress indicators so students know how much remains. Offer save-and-continue functionality so applicants don’t lose work if interrupted. These user experience improvements can dramatically increase application completion rates.
Effective enrollment funnel metrics for higher education provide visibility into every stage of the student journey. Tracking these metrics consistently reveals bottlenecks and optimization opportunities.

This measures what percentage of inquiries convert to submitted applications. Low rates suggest problems with lead quality, nurturing effectiveness, or application process complexity. Strong programs typically see inquiry-to-application rates between 30-50%, though this varies significantly by institution type and selectivity.
This reflects your institution’s selectivity—what percentage of applicants receive admission offers. While this is primarily determined by academic standards, tracking trends over time reveals whether standards are becoming more or less selective.
Perhaps the most critical metric, yield rate measures competitive positioning. A declining yield rate suggests that admitted students increasingly choose competitors. Strong yield rates for competitive four-year institutions range from 20-40%, while highly selective schools may exceed 50%.
This financial metric divides total marketing and admissions expenses by the number of enrolled students. It reveals the true cost of enrollment growth and helps optimize budget allocation across channels.
How quickly does your team respond to inquiries and questions? Fast response times strongly correlate with higher conversion rates. Leading institutions respond to digital inquiries within minutes, not hours or days.
The right technology stack is fundamental to improving admission and enrollment conversion rates. Manual processes simply cannot compete with automated, data-driven approaches in today’s competitive enrollment environment.
A purpose-built CRM for higher education serves as the central nervous system of your enrollment operations. Unlike generic CRMs designed for sales teams, education-focused platforms understand the unique requirements of admissions processes.
The best CRM for improving student enrollment conversion offers:
The difference is stark:
Manual Process: Student submits inquiry → Inquiry sits in shared inbox → Counselor eventually notices → Counselor sends generic email → Student never responds → Opportunity lost.
Automated Process: Student submits inquiry → Instant personalized response → Lead automatically assigned based on territory/program → Counselor receives mobile alert → Personalized follow-up scheduled → Nurturing workflow begins → Student stays engaged → Conversion increases.
Automation doesn’t replace human connection—it amplifies it by handling routine tasks, so counselors can focus on meaningful conversations that build relationships and drive enrollment decisions.
LeadSquared’s Student Enrollment Management CRM is a comprehensive platform built to transform how universities, colleges, and training institutions attract, engage, and enroll students. LeadSquared Higher Education CRM unifies marketing, admissions, and student engagement processes into a single system—eliminating silos and manual work. With automated lead capture from all channels (web, social, walk-ins, education fairs, and partner portals), it ensures no inquiry goes unanswered.

Intelligent lead scoring, counselor allocation, and workflow automation enable institutions to nurture students through personalized communication across email, WhatsApp, and text. Detailed analytics and dashboards provide real-time visibility into applicant journeys, marketing ROI, and counselor performance—empowering institutions to make smarter, data-driven enrollment decisions.
The value is clear: higher conversions, faster enrollments, and better student experiences. The system doesn’t just track leads—it actively drives them toward enrollment through automation, personalization, and integrated communication.
Adding to this, FloStack by LeadSquared acts as a next-generation engagement engine that complements the CRM with real-time response, process automation, and microsite capabilities. The platform ensures that key contact details are shared instantly the moment a prospect interacts with your web forms—eliminating delay and maximizing the moment of engagement. It also supports seamless scheduling (meetings, campus tours), event management (registrations to check-ins), and automated confirmations, while giving visibility into which prospects are most active or ready to convert.

“LeadSquared offered a modern platform with strong automation and integration capabilities that aligned perfectly with our strategic goals. Its flexibility and robust features were exactly what we needed.”
– Ryan Tipton, President, University of the Southwest (USW)
Read more: University Of The Southwest Transforms Enrollment Efficiency With LeadSquared
Rather than fixating on national averages, focus on three benchmarking approaches:
Improving your admissions conversion rates and enrollment conversion rates isn’t a one-time project—it’s an ongoing commitment to continuous improvement, alignment, and optimization. The most successful institutions embrace data-driven decision-making. They track metrics religiously, test new approaches systematically, and adjust strategies based on evidence rather than assumptions. They recognize that even small improvements in conversion rates at each funnel stage compound into significant enrollment gains.
Your admissions team needs the right tools, training, and support to engage today’s digitally native students effectively. Marketing and admissions must function as integrated partners, sharing data and insights to optimize the entire enrollment journey.
Most importantly, remember that behind every conversion rate statistic is a prospective student making one of life’s most significant decisions. The institutions that combine data-driven efficiency with genuine human connection—that automate routine tasks while personalizing meaningful interactions—will win in today’s competitive enrollment environment.
With purpose-built tools for higher education, comprehensive analytics, and proven results at hundreds of institutions, LeadSquared empowers admissions teams to convert more prospects into enrolled students.
Frequently Asked Questions (FAQs)
Admission conversion rate typically measures the percentage of applicants offered admission, while enrollment conversion rate (or yield rate) measures the percentage of admitted students who actually enroll. Enrollment conversion rate is usually the more critical metric of the two, because it reflects student choice and competitive positioning.
For traditional four-year institutions, an overall inquiry-to-enrollment conversion rate of 10-15% is considered solid, though this varies significantly by institution type. Yield rates (admission-to-enrollment) typically range from 20-40%. Community colleges and online programs may see different benchmarks based on their unique student populations and competitive dynamics.
What is the conversion rate for enrollment?
The enrollment conversion rate measures how many applicants actually complete the enrollment process after receiving an offer of admission. It indicates how effectively your institution turns accepted students into enrolled students. For example, if 1,000 students are offered admission and 400 enroll, your enrollment conversion rate is 40%. A higher rate typically reflects strong follow-up processes, effective communication, and positive applicant experience — all of which can be improved through an automated education CRM system like LeadSquared.
The admission rate (also known as the acceptance rate) is calculated by dividing the number of students admitted by the total number of applicants, then multiplying by 100.
Formula:
Admission Rate = (Number of Students Admitted ÷ Total Applicants) × 100.
For instance, if your university received 10,000 applications and admitted 1,000 students, the admission rate would be 10%.
A 7% acceptance rate means that out of every 100 applicants, only 7 are offered admission. This indicates a highly selective institution — typically seen in top-tier universities. A lower acceptance rate suggests higher competition and stronger applicant demand. However, for most institutions, the goal isn’t exclusivity but improving yield — ensuring that more of the students who are admitted actually enroll.
The admissions conversion rate measures how many prospective leads or applicants successfully move through the admissions funnel to become enrolled students. It’s often tracked from initial inquiry to final enrollment.
This rate helps institutions evaluate the effectiveness of their marketing, counseling, and communication strategies. With automation from LeadSquared’s Enrollment Management System, colleges can significantly improve this rate by minimizing manual follow-ups and reducing lead drop-offs.
Calculate enrollment conversion rate by dividing the number of enrolled students by the total number in your starting pool, then multiplying by 100. For overall conversion: (Enrolled students ÷ Total inquiries) × 100. For yield rate: (Enrolled students ÷ Admitted students) × 100. Track conversion rates at each funnel stage to identify specific improvement opportunities.
Common causes include slow response times to inquiries, lack of personalized communication, complicated application processes, poor lead quality, insufficient follow-up with admitted students, increased competition, or misalignment between marketing and admissions efforts. Analyze your funnel by stage to identify where the biggest drop-offs occur, then implement targeted solutions.
A dedicated CRM for higher education, like LeadSquared, is foundational. It enables automated lead capture, personalized communication workflows, behavioral tracking, and comprehensive analytics. Complementary tools include marketing automation platforms, AI chatbots for instant inquiry response, mobile-optimized application systems, and integrated analytics dashboards that provide real-time visibility into conversion metrics — all of which LeadSquared provides.
Research consistently shows that institutions responding within 5 minutes are dramatically more likely to engage prospects than those delaying response for even an hour. Implement automated instant acknowledgment emails or text messages, followed by personalized counselor outreach within 24 hours. Speed-to-lead is one of the most impactful factors in improving inquiry-to-application conversion rates.
Improving conversion from inquiry → application → enrollment starts with speed, relevance, and consistency. Respond to every inquiry quickly (ideally within minutes), personalize communication based on the student’s intent, source, and program of interest, and ensure counselors have full context before engaging. Nurture prospects with timely follow-ups, clear next steps, and value-driven messaging (deadlines, scholarships, outcomes). Reducing friction—shorter forms, guided application journeys, and proactive reminders—helps prevent drop-offs at the application stage.
To move applicants to enrolled students, focus on strong engagement and visibility across the funnel. This is where a platform like LeadSquared makes a difference: it centralizes all leads, automates multi-channel follow-ups (calls, WhatsApp, email, SMS), tracks counselor activity, and provides real-time funnel analytics. With LeadSquared, teams can identify leakage points, prioritize high-intent applicants, and ensure no lead is missed—resulting in higher conversions, better counselor productivity, and predictable enrollments.


 5 Best CRM for Medical Device & Healthcare Field Sales