


- Home

- Learn
- Healthcare
- Healthcare Dashboard: Types, Benefits, and KPIs to Track
HEALTHCARE
Healthcare Dashboard: Types, Benefits, and KPIs to Track
Contents

Healthcare workers collect vast amounts of information, but it’s often scattered across different departments and stored in various systems like Electronic Health Records, Medical Billing Systems, and Patient Management Systems. These systems often lack integration, and most of the times store data in different formats, resulting in blind spots for the staff, as well as incomplete patient profiles.
Healthcare Dashboards can integrate this data, providing clear, actionable insights, and ensuring that all the stakeholders have access to the same clear information.
Healthcare dashboards are analytical, comprehensive, and dynamic tools that offer a streamlined, transparent report of key performance indicators (KPIs) for the entire team
Metrics reported visually can solve the issue of information overload in hospitals, simplify information processing and enable the healthcare personnel to get the best insights from the available data. Healthcare organizations can use these insights to enhance patient care and make better decisions. Modern healthcare analytics and dashboards can help:
Additionally, automated healthcare reports ensure you never miss a data update. Together, these measures empower staff to deliver exceptional patient care.
A great example of healthcare dashboards in action came during the pandemic. The German hospital chain Asklepios’ CIO, Henning Schneider, oversaw the development of a dashboard for its 65 facilities.
The dashboard offered an overview of patients who required intensive care units (ICU), ventilators, and cardiac support, as well as the availability of beds and ventilators.
The dashboard was successful in indicating when the hospital occupation rates were becoming too high.
Dashboards are quickly becoming indispensable for healthcare workers, and we’ll soon discuss the different kinds of insights they can deliver. However, before we get into the specifics, let’s look at the key benefits they bring to the table.
Improved care in turn translates to higher patient satisfaction as well.
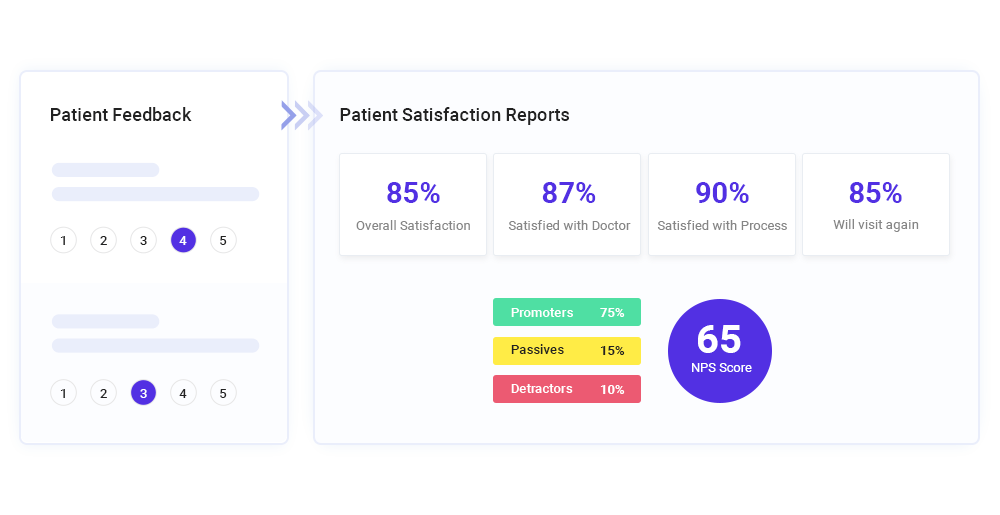
For example, a patient satisfaction dashboard can help hospital teams track satisfaction scores, spot trends, and create strategies to improve the patient experience, enhancing loyalty.
Patient satisfaction dashboards can help hospitals improve every step of the patient journey – including patient intake, onboarding and other processes even before the appointment.
Dashboards give healthcare professionals accurate, timely insights on patient outcomes, treatments, and resource use. These tools help identify best practices, optimize resources, and improve care. Data visualization simplifies complex information, making it easier to develop evidence-based treatment plans and enhance patient safety.
Healthcare dashboards can help streamline operations by analyzing data on patient flow, resource use, and other operational metrics. For instance, operational dashboards can help the intake staff track wait times, address bottlenecks, and improve patient throughput, boosting efficiency while reducing costs and enhancing the patient experience.
Dashboards allow administrators to monitor staff performance, workloads, and adherence to protocols. By tracking KPIs like treatment times or task completion, managers can pinpoint inefficiencies and foster accountability. Transparent performance data helps improve workflows, care quality, and patient satisfaction.
Population health dashboards provide insights into trends like disease prevalence or readmission rates, enabling preventive strategies and better chronic disease management. Tracking at-risk groups ensures timely care, reduces disparities, and supports healthier communities.
Financial Dashboards can track expenses, revenue cycles, and cost efficiency, helping administrators identify cost-saving opportunities without sacrificing care quality. Visibility into operational costs, and revenue cycles can help providers optimize staffing, reduce waste, and improve resource allocation to ensure efficient operations and profitability.
Dashboards offer real-time visibility into regulatory adherence and patient safety protocols. They flag issues like incomplete documentation, helping organizations address problems before they escalate. This reduces risks, avoids penalties, and supports patient safety.
Dashboards help teams respond quickly to emergencies by showing live updates on patient data, resource availability, and workflow status. For example, emergency dashboards highlight bed availability and staff readiness, enabling swift action that saves lives and improves outcomes.
Here’s a quick comparison table that helps you decide which healthcare dashboard you need to choose based on your hospital’s challenges.
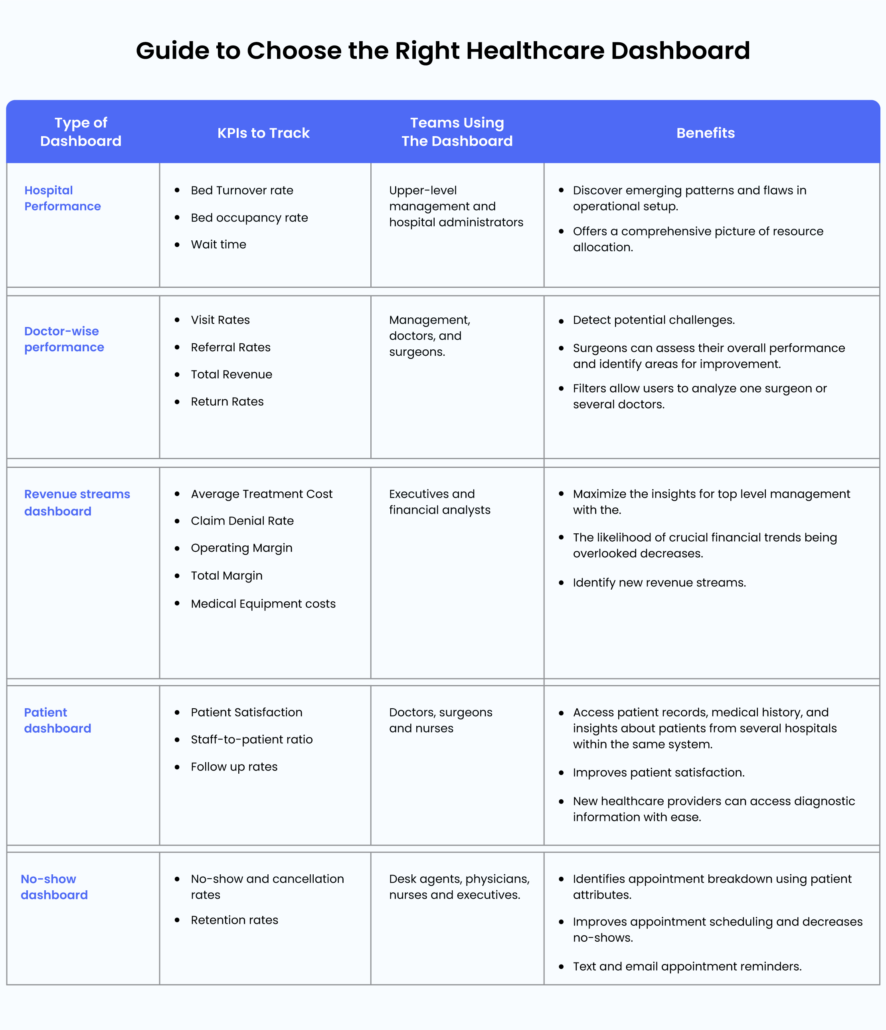
You can also download this guide to share it with your team or refer to it later: Guide to Choose the Right Healthcare Dashboard.
A hospital performance dashboard condenses enormous amounts of data, such as patient satisfaction, intake numbers, and staff performance. It is ideal for executives responsible for formulating the hospital’s strategy.
It’s useful for those who need to know which initiatives will have the greatest positive impact. The visuals can also help users align strategic projects to KPIs and goals.
Users can discover emerging patterns and flaws in their operating setup. Additionally, hospital analytics provide a comprehensive picture of resource allocation as it tracks the demands and performance of every unit in a hospital.
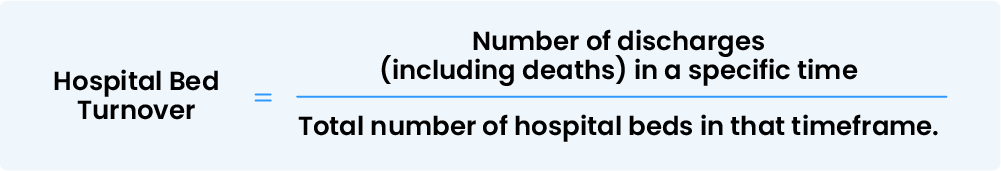
The top KPIs to track for hospital performance are:
This hospital statistic demonstrates how rapidly outgoing patients are replaced by incoming ones.
Provides information on the number of vacant beds. A high number of vacant beds is a tell-tale sign of stagnation. Reducing these percentages is essential to the growth and expansion of an organization.

Patient wait time has a vital influence on patient experiences and retention. These insights enable management to identify the points of lengthy wait periods and make improvements. Hospital administrators can accordingly increase the number of employees, offer training to improve efficiency and implement technology for higher productivity.
A dashboard is critical to accurately calculate this KPI, as staff cannot track such information manually. Management needs such dashboards to make informed decisions for their facility’s growth and progress, without compromising on quality of care.
These dashboards will assist you in making improvements on a clinical, functional, and financial level.
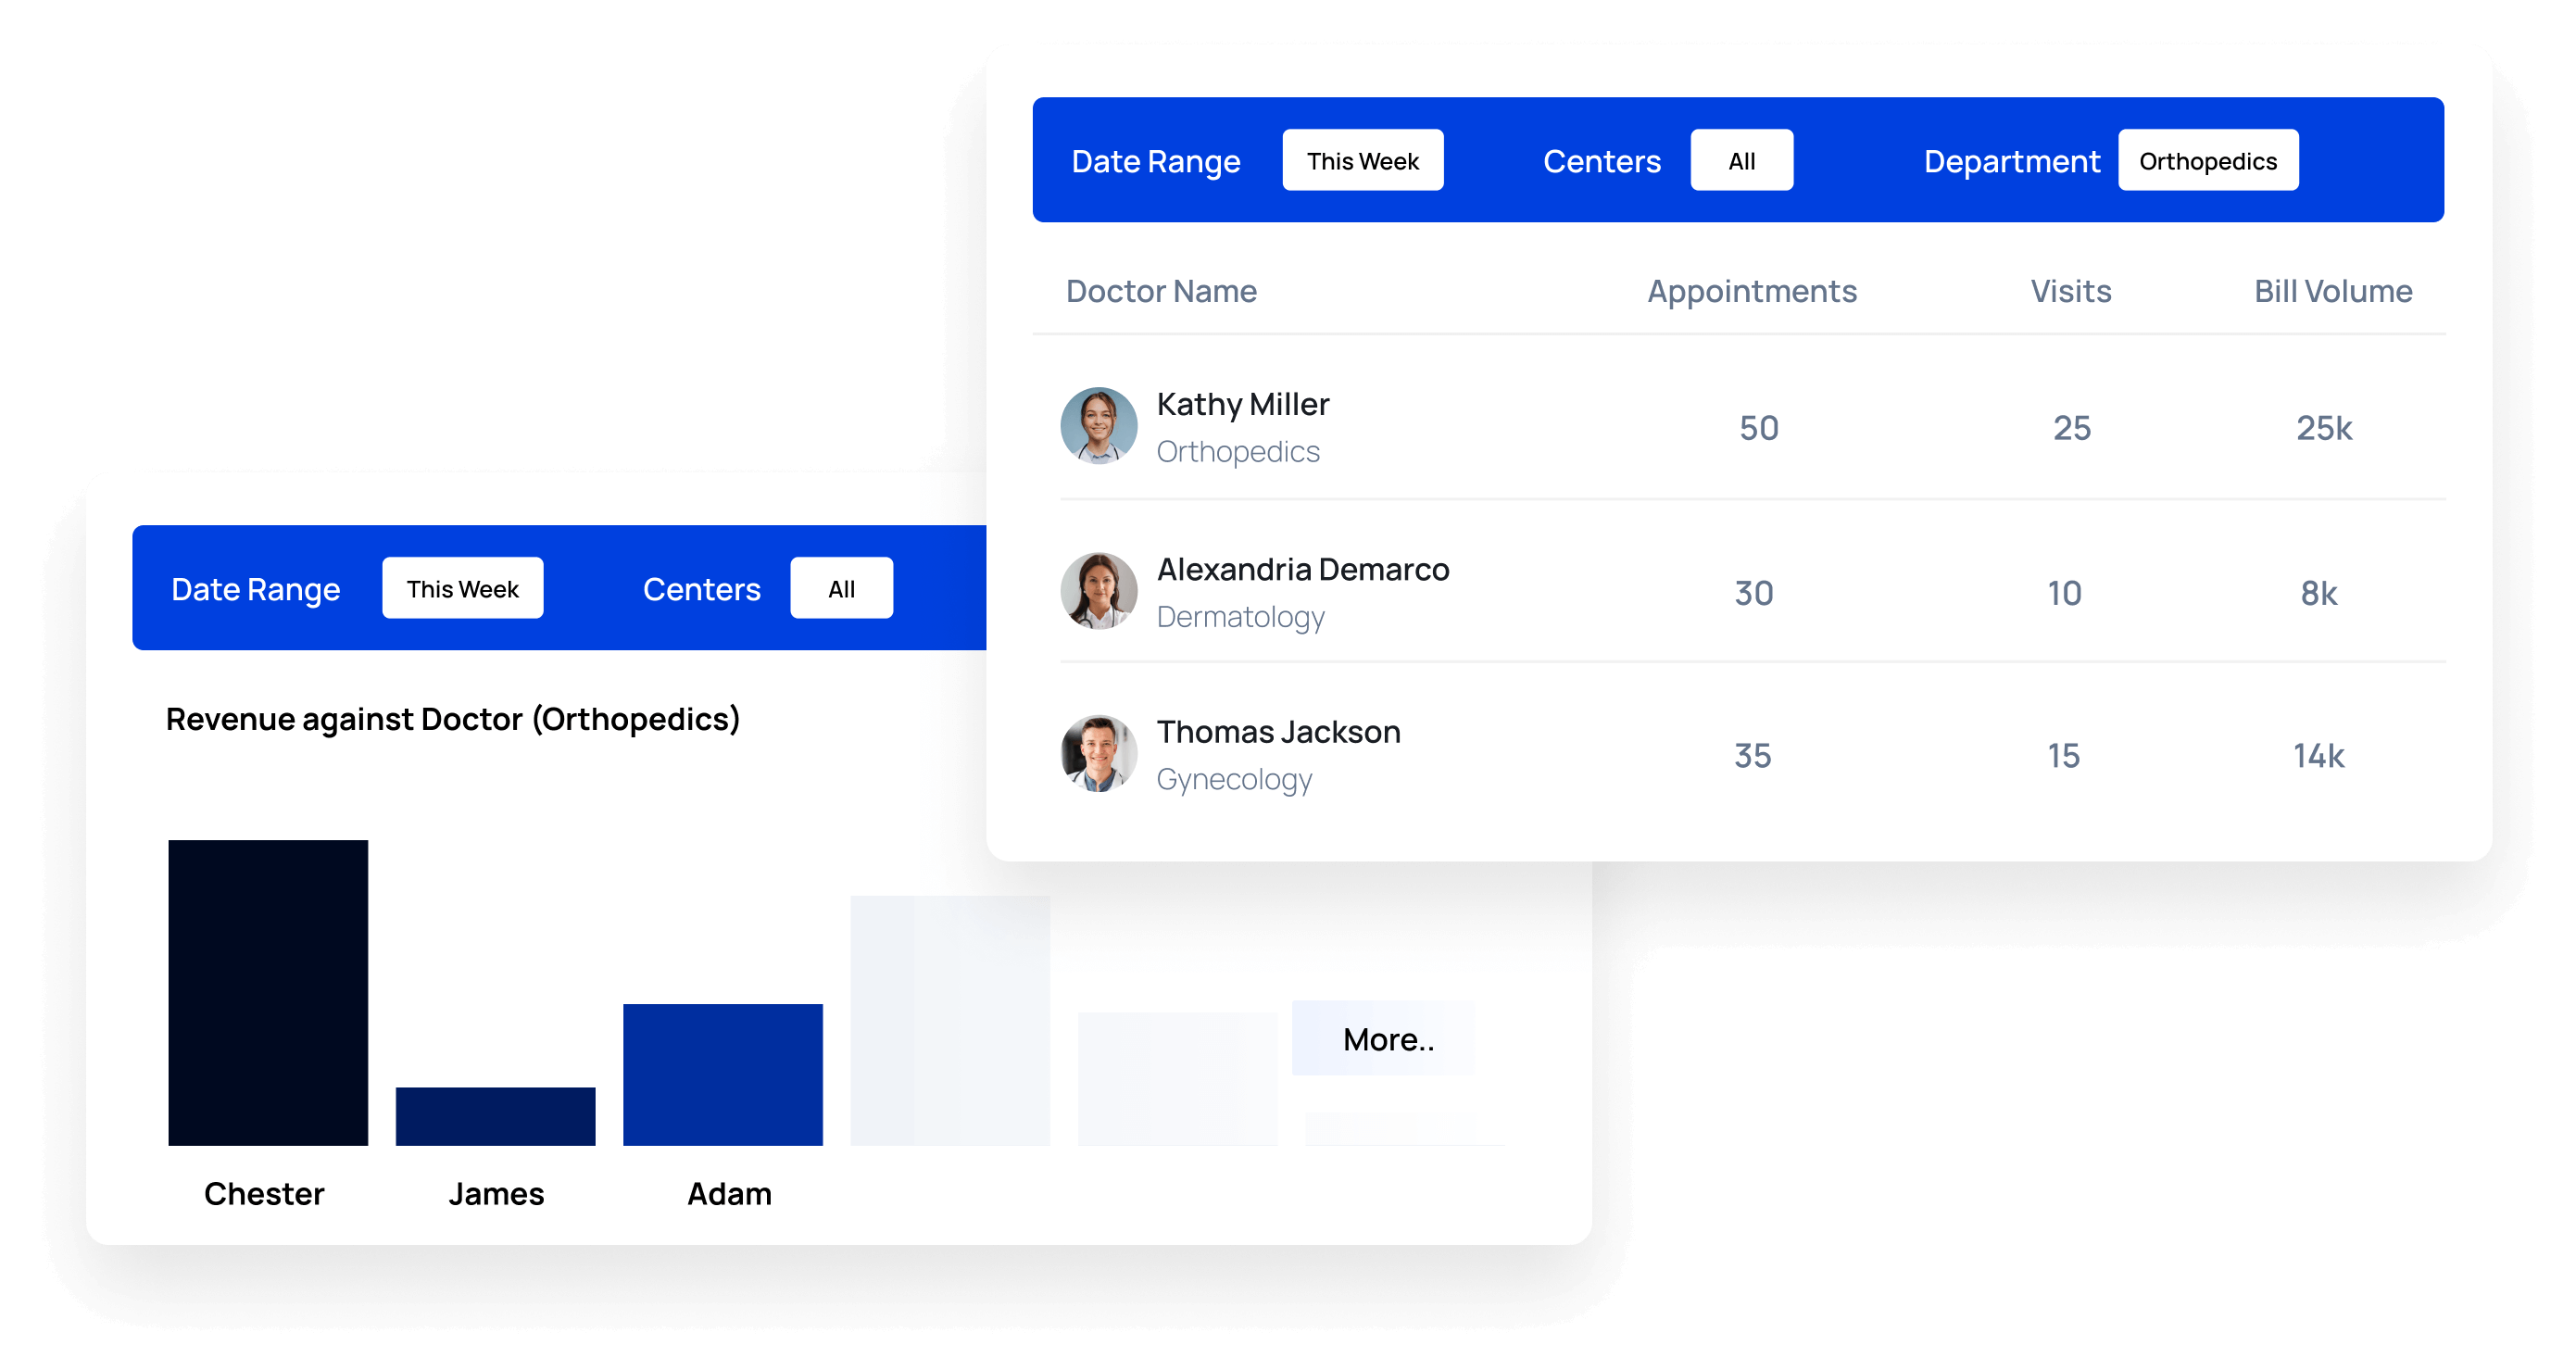
A physician-wise performance dashboard analyzes a doctor’s performance in real-time. Some of these are:
The Johns Hopkins School of Medicine is measuring the quality of its physicians using a data-driven Provider Dashboard. Previously, measuring performance was tricky since a physician may conduct the surgery but might not be the sole person caring for the patient.
That is no longer an issue with a dashboard that can track doctor-wise care provided for patients. Hospitals can also use this dashboard to align bonuses based on performance metrics.
A user can instantly detect potential challenges, such as a surgeon spending a significant amount of time in the operating room for very few surgeries. Department heads can gain insights into:
These factors help determine if those characteristics explain the time spent. The best part is that they can do it without spending hours preparing several spreadsheets or charts as reports.
Additionally, surgeons could assess their overall performance and identify areas for improvement. Users may use filters in many ways to analyze one surgeon or several doctors. The top KPIs to track for doctor-wise performance are:

Executives and financial analysts use revenue dashboards for medical providers to track revenue indicators. These dashboards can be integrated with electronic health records for accurate and comprehensive financial data. This sort of dashboard provides users with a transparent interface to evaluate:
Users can segment the visuals into more actionable information using the filters. The primary goal of a hospital is not to generate revenue. But they cannot stay afloat without ensuring they make meets end. Positive financial indicators are the benchmarks of a successful operational strategy.
Additionally, clinics can use such a dashboard to identify new revenue streams. For example, hospitals can provide comprehensive digitized medical supplies to clients on a monthly subscription basis. Figuring out such information requires you to track and monitor several KPIs, some of which are:
It underlines the average amount of money each patient spends in a hospital. Although it can be alluring to increase this expense to boost the hospital’s profit, keep in mind that a hospital’s primary goal isn’t to turn a profit. The objective of every hospital must always be to provide high-quality medical care. The pursuit of higher profit margins shouldn’t come at the expense of patient satisfaction.

This hospital metric offers a glimpse into the facility’s day-to-day operations. It is directly related to the KPIs for cost and processing time for insurance claims. A low incidence of claim denials demonstrates the hospital’s ability to prioritize its patients.

This is when hospitals calculate their margin solely using revenues and costs associated with patient care. As a portion of operational revenue, it describes the gap between operating revenue and costs.

It demonstrates the healthcare provider’s profitability by showing how expenses and revenues balance out at the end of the day.

This healthcare measure indicates how often the equipment is in use. And, subsequently, how much it costs to maintain.
Healthcare technology constantly evolves, which inevitably causes equipment to become old or inadequate. Neglecting the KPI for medical equipment utilization will result in exorbitant maintenance costs and lost labor. You need to keep track of inventory and equipment, their cost, usage, and expense over time.
This dashboard is ideal for accessing patient records, medical history, and insights about patients from several hospitals within the same system. The patient dashboard significantly cuts down the time it takes to respond to a patient and improves overall client happiness.
Repeating the same information to various doctors is one of the most difficult tasks a patient must undertake. But healthcare facilities can extract data from an EHR record and integrate it with the dashboard on their CRM to access patient information within the hospital’s system, The dashboard helps you organize the data you frequently view in one area. This would make the intake process more efficient, reduce errors, and spare the patients from repeatedly sharing the same information.
It’s important to keep in mind that patients who are discontent are less likely to return to your facility. Moreover, after a negative experience, they won’t refer your clinic to friends and family, or worse, can steer them away from it.
In the internet age, “negative buzz” may spread quickly and is difficult to stop. Utilizing a healthcare dashboard of this kind might be beneficial, primarily when communicating with patients.
The top KPIs to track using this dashboard are:
The healthcare KPI that will encourage or, on the other hand, deter potential patients is the patient satisfaction rate. The higher the patient satisfaction rate, the better. This metric highlights feedback on how patients perceive your treatment and help identify areas of improvement. The patient satisfaction score necessitates surveys and feedback forms from which you can assess and analyze the average score.
This hospital measure displays the staffing levels in the clinical setting. Your staff management procedures’ effectiveness depends on the staff-to-patient ratio. It indicates whether the hospital has an excess or a shortage of staff.

This measure addresses patient care after they undergo treatment. Simple check-ups, physical examinations, new prescriptions, blood tests, and consultations are a few examples of proactive follow-ups.
Monitoring follow-up rates by departments and determining the type of care patients most urgently want will help you successfully assist patients through their treatment. This rate requires you to track and monitor your staff’s activities to get an accurate score.
According to studies, no-show patients cost the healthcare industry $150 billion annually. When people miss appointments, it negatively affects other patients who might need treatment for critical illnesses and would otherwise be unable to wait.
Ultimately no-show patients negatively affect overall performance. You can decrease no-shows by implementing this dashboard for your business and using patient engagement strategies to confirm appointments via text message or by leaving a callback request.

The No-Show dashboard’s high prediction rates enable you to prioritize people who need treatment the most and avoid any revenue loss. Dashboards improve appointment scheduling by helping you identify the patterns of no-show by:
KPIs to track in this dashboard are:
No show rates depend on specific data like cancellation rates and late arrivals. However, since tracking the no-show rate is the most revealing measure for patient visits, you can calculate the other rates afterward.

Patient retention strategies should be in place since return clients are the most valuable and steady clients. Measuring the return rate of patients to doctors in the organization indicate whether your efforts are successful. Evaluating the return rates for different doctors is also necessary for allocating bonuses and assisting those with lower rates.
A referral dashboard provides an overview of referral volume, sources, and outcomes, helping healthcare providers improve their referral strategies.
Key KPIs to track:
An appointment dashboard tracks scheduling efficiency, cancellations, and patient attendance to ensure better resource use and patient satisfaction.
Key KPIs to track:
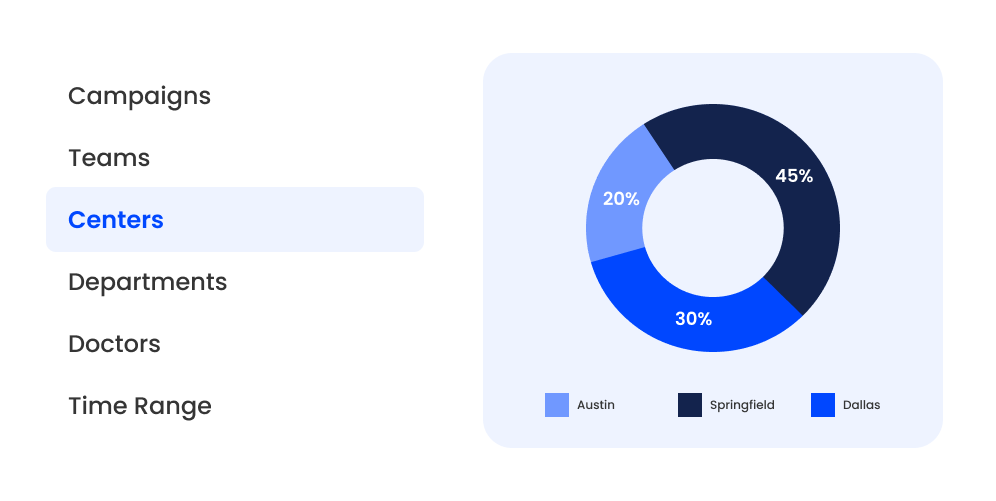
A center management dashboard consolidates data from multiple hospital locations, enabling executives to compare performance, allocate resources, and identify improvements.
Key KPIs to track:
KPIs are measurable values that show how well an organization is meeting its goals. They help track patient care, financial performance, and operational efficiency in healthcare. While we have discussed the key KPIs for each dashboard, here’s a summary of the important KPIs to monitor using your healthcare dashboard:
Building the ideal dashboard differs for different facilities, specialities and departments. Reaching out to software companies and figuring out what works best for your needs is the first step to building the best dashboard.
Undoubtedly, the most crucial aspect of designing a healthcare dashboard is selecting the appropriate metrics. Before building your dashboard, choose KPIs unique to your goals and needs.
Apart from this, some features are absolute must-haves and are non-negotiable. The data collection, processing, and presentation solution for hospitals must make the following features available:
1. The dashboard should represent KPIs according to:
2. The dashboard must emphasize trends wherever feasible against
3. Every dashboard should empower a user and offer the following standard features:
Building the ideal dashboard for your organization will necessitate a good deal of effort. But each dashboard offers a path to positive caregiving practices.
At the heart of it, your dashboard should offer robust tracking and reporting features to manage patient journeys effectively. Tracking each KPI requires a solution that offers real-time reports and notifies users of any upcoming trends.
Moreover, it should unify and centralize patient data for all the parties with access to their information. If you’re looking for one such tool that empowers your healthcare services, try LeadSquared’s Healthcare CRM!
LeadSquared offers a powerful dashboard solution tailored to healthcare organizations, delivering these key benefits:
LeadSquared’s customizable dashboards empower healthcare businesses to track critical metrics, improve efficiency, and address challenges in real time. Whether it’s patient engagement, appointment scheduling, or operational performance, these dashboards deliver actionable insights to optimize clinic operations.
No matter your unique needs, LeadSquared can customize a solution to meet your healthcare management goals. Get in touch today to explore how we can help!
A healthcare dashboard is a tool that visualizes real-time data on key performance indicators (KPIs). It consolidates information from multiple sources, like EHRs and financial systems, to provide a clear overview of organizational performance.
Healthcare dashboards enhance decision-making, improve patient care, increase operational efficiency, ensure regulatory compliance, and promote transparency across teams.
These dashboards typically feature clinical data (e.g., patient outcomes, readmission rates), operational metrics (e.g., staff productivity, bed utilization), financial information (e.g., revenue, expenses), and patient experience metrics (e.g., satisfaction scores, feedback).
By providing real-time insights, dashboards help detect issues early, support personalized treatment plans, reduce errors, and enhance communication among care teams, ensuring timely and effective care.
Look for a dashboard that is scalable, customizable, and compatible with your existing systems (e.g., EHRs). It should be HIPAA-compliant, provide real-time updates, and have an intuitive interface. Ensure it aligns with your organization’s unique requirements and budget.
Enter your details and we'll send you a quick confirmation email to verify your address.


 What do you do when a prospect is not responding to follow-ups?