


MARKETING
What Is An Analytics Dashboard & Why Is It Important?
Contents
How would your business change if you could see everything that happened during the marketing and sales process? You’d be able to make informed decisions on how to improve your processes and you could focus your energies on the areas that needed attention without having to guess which parts to look at first.
In short, tracking and monitoring give you an insight into the inner workings of your sales & marketing function and gives you the information you need to make effective changes.
Analytics are the results from taking data and analyzing it through a predefined process. For example, analytics for your website can show you how many visitors you had in a single day, how many bounced off, how many took any action and how many of them got converted into leads.
This is a result that is produced by monitoring the website and noting when every individual visitor arrives. This raw data can then be shown after analysis with conditions imposed by the user – instead of a single day, you might want to know how many people visited over the course of a week but only in the evening.
The data is processed, and the results are shown in an easy-to-read format – but how is that relevant to your business?
Any business will have raw data that can be processed. This will include the number of sales made, the location sales were made at, the salesperson who made the sale, and so on. This is basic information that every business needs to survive – if you don’t know how much you’ve sold, where it was sold, and who sold it, can you actually say you are running a business? It sounds more like the business is just happening while you watch it, and you have no control over it.
In this modern internet-enabled age, far more information can be stored and tracked. Everything your sales team does can be recorded, including information relating to when they make phone calls, send emails, arrange meetings, send out quotations, and when they close deals.
Lead information can also be recorded, such as how they found out about your business, what products they are interested in, their demographic information, what time of day they are most likely to be looking at your website, and so on.
Your marketing process and website can be tracked too. Advert performance can be monitored, as can simple information like when a visitor arrives at your landing page – as well as more detailed information that includes the path they take through your website. This can be cross-referenced with what you might already know about this lead and built up into a strong profile of what this lead is looking for and how to service their needs.
KISS, an acronym for Keep It Simple Silly, is an important feature of analytics. With so much data, it is easy to be overwhelmed by sheer numbers. Many analytics products will show you every piece of data that they can in the hope that you’ll find something useful, or just be so confused that you think this display of numbers is actually relevant.
There are certain metrics that are important to every business – for example, how much money is coming in. If your revenue is too low, you need to do something about it, but trying to wade through all the irrelevant information to find a solution can be a fruitless task.
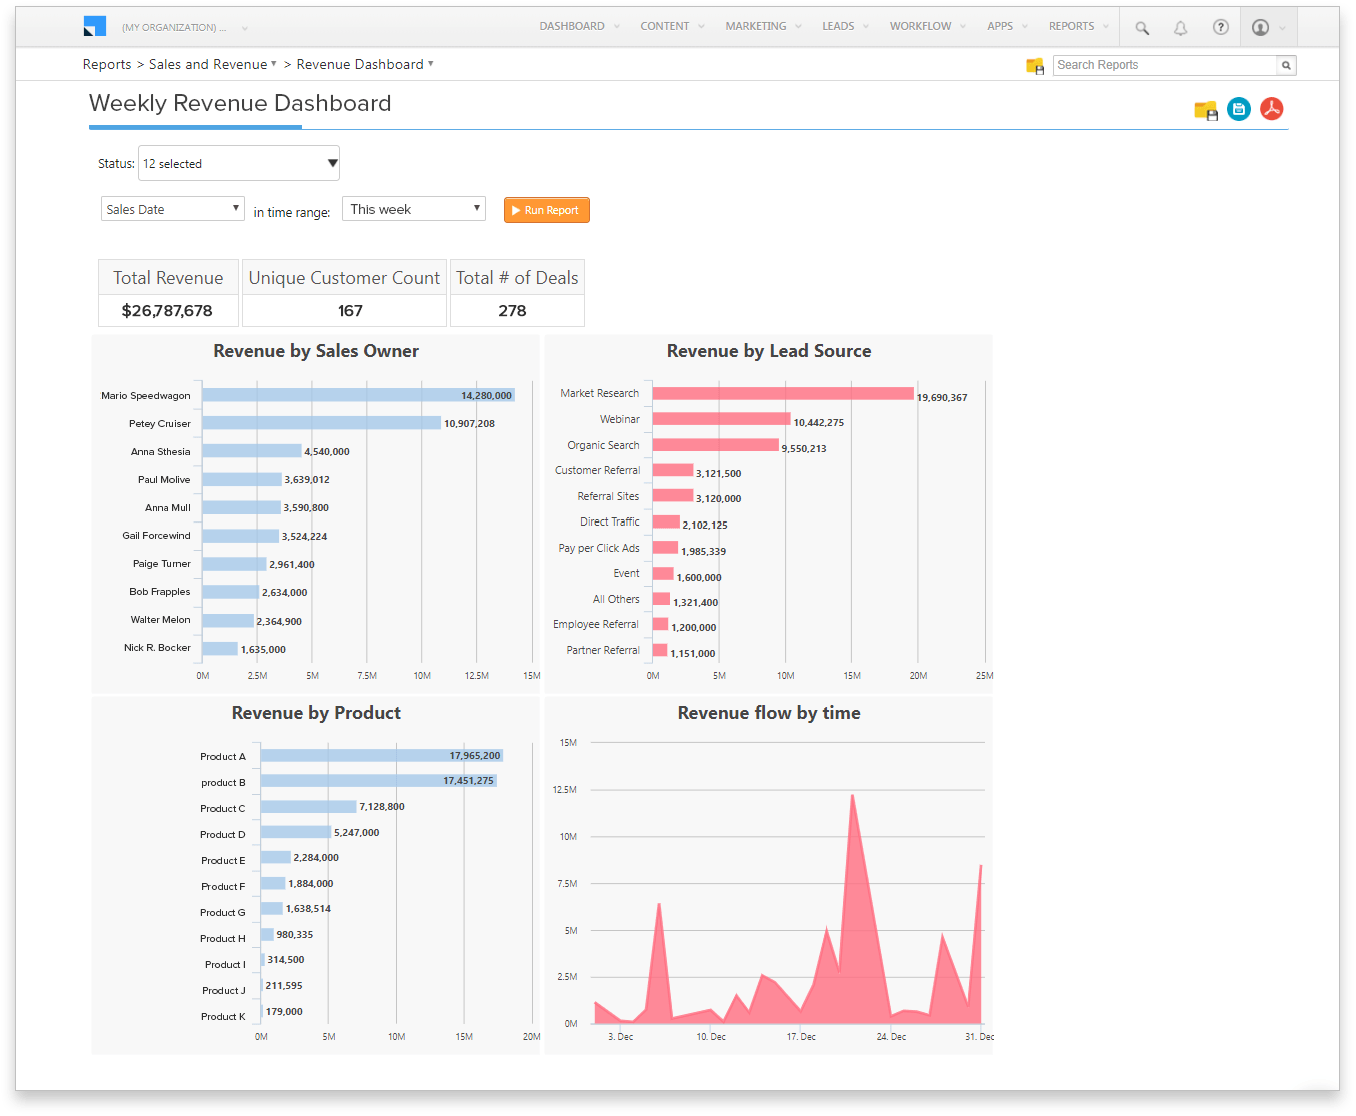
LeadSquared takes a different approach. Knowing that every business is different in both setup and structure, LeadSquared allows you to build your own Analytics Dashboard that shows the numbers, information, and reports that are relevant to you.
Not only can you choose individual reports, but you can also filter the information provided in these reports to give you an in-depth but completely understandable overview of what is occurring in your business.
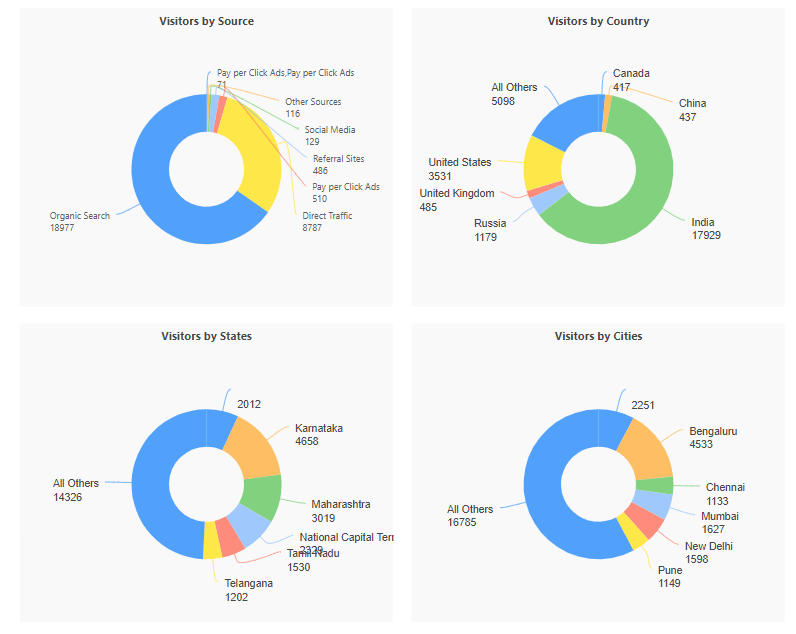
Take the website example above and add to it information that includes an automated email campaign and salesperson follow-ups. You can see that you received an equal number of leads visiting the site from three separate ad campaigns on three different platforms. Every lead from two platforms requested further information via a form on the site – which means one of these ad platforms is not working for you.
Of these leads, 60% responded to the email they received as a result of filling in the form. You can see how many returned to the website and looked at information on other products.
You can follow these leads through the sales process and see how successful your sales team were at converting them into paying customers, and from all this information you can predict how similar leads will behave in the future and produce sales forecasts that are accurate and allow you to plan for the future.
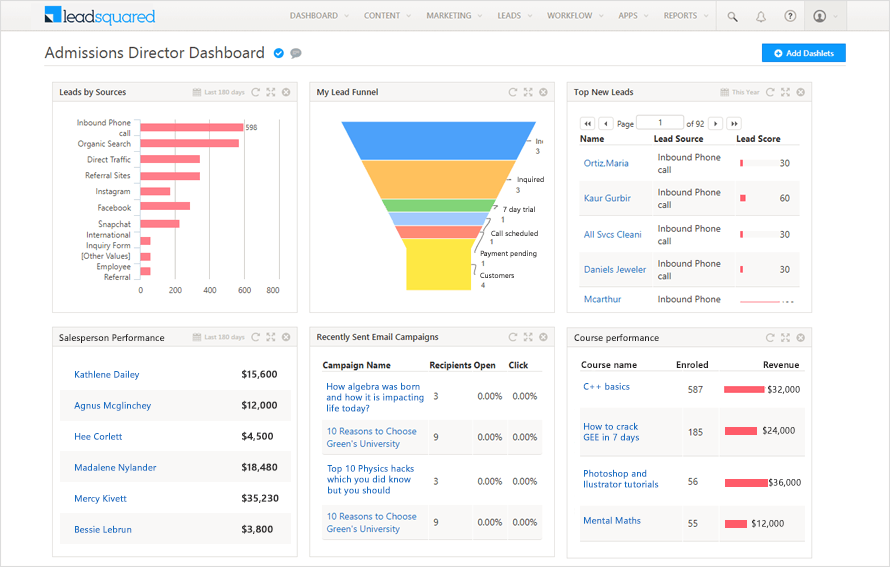
You can compare the effectiveness of different landing pages, different salespeople, and how well products sell. You will be able to discover which products sell best in which geographic locations, and you’ll easily find which members of your sales team find it easy to convert leads into customers.
The Analytics Dashboard you put together with LeadSquared is built by you to show the exact information you want. You can start with an entirely blank canvas and add Dashlets to it as necessary, giving the functionality you desire with none of the bloat and excess that you don’t need.
Do not misunderstand – all the information about every aspect of your sales, marketing, and business performance is recorded and monitored by LeadSquared, but it isn’t presented to you in an overwhelming manner. Most successful businesspeople run their businesses by looking at the metrics they know they need to take care of, and so LeadSquared makes it easy to build a custom dashboard to facilitate this.
There are always new opportunities to be found to improve your sales pipeline and make more higher-value sales, and the effective use of analytics will enable you to guide your business towards this.
You’ll see your strengths, identify the weak links, and be able to make balanced judgments on the best way to take your business to the next level.
If you’ve never made the leap to properly track your business analytics, now is the time to start. There’s no better way to improve your bottom line than by discovering exactly what it is that makes your business tick.
Enter your details and we'll send you a quick confirmation email to verify your address.


 What Is A Business Dashboard And Why Is It Important?