


EDUCATION
Demystifying Data for Strategic Enrollment Management
Contents
If you’re in higher education and not using data to support your strategic enrollment decisions, you’re not alone but you’re seriously missing out.
The disconnect between data collection and data usage among colleges and universities has posed an industry problem for at least 10 years. Scattered silos, misaligned information systems, and an influx of raw, uncontextualized data have compounded the issue threatening to hold institutions back at a time when educational models are shifting and competition shows no signs of slowing down.
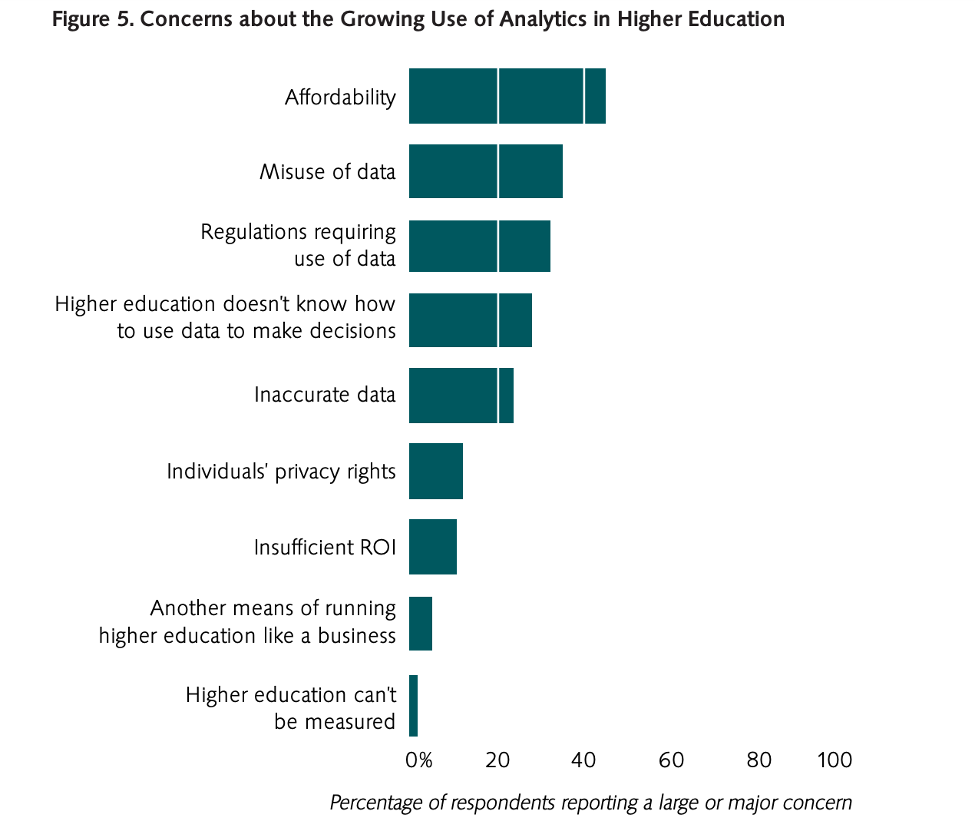
Confusion about how to use data in order to drive decisions has been a higher ed concern since (at least) 2012.
But while this disconnect is understandable, the fact remains:
Data is essential to higher ed optimization, particularly in admissions.
For those higher ed enrollment professionals hoping to get on the data train and begin implementing analytics-driven processes in earnest, here’s an overview of data, including what it’s good for, where to find it, and how to mine it for maximum results.
In our uber-digital age, much has been made of the power of data, capable of providing a virtual window into the lives of target audiences (both niche and wide).
With current technologies able to capture everything from where and when consumers buy their daily latte to how many literal steps they take in a day, it’s become much, much easier to keep your finger on the pulse of buyer behaviors and social trends.
Put in higher ed terms, the benefits of data allow admissions and affairs teams to:
All these methods amount to a simple yet powerful equation:
data = 360° knowledge of your prospects & processes = more efficient practices going forward
In short, data helps ensure your teams are never caught unprepared.
Obviously, data comes in many forms, some of which can be more effective than others, depending on the task at hand. Here are just a few data features you should look out for when gathering info on prospective students, current enrollees, and/or in-progress campaigns:
Is it clean?
“Clean data” refers to data that’s been purged of all mistakes and inconsistencies to improve accuracy and remove extraneous information. As you collect your data, be wary of:
Is it numbers-driven or more conceptual?
Data typically fall into either a “qualitative” or “quantitative” category.
Is it aligned with your goals?
Too much data isn’t necessarily a bad thing, but sometimes the information you collect has little to no bearing on what you’re trying to achieve. Wherever possible, discard data that are interesting but not essential. As the Educause Center for Applied Research recommends, start with the challenges you wish to tackle head-on, then craft your data and analytics around them.
That is, let data follow your objectives—not the other way around.
Exactly how you collect your data will hinge on your audience, your institution, and the resources you have available. Here’s some food for thought on how best to get started:
Look to social media and the web
With 85% of Americans now in possession of a smartphone and the vast majority of 18- to 29-year-olds reporting at least some form of social media use, it’s safe to assume much of your target demographic can be found online.
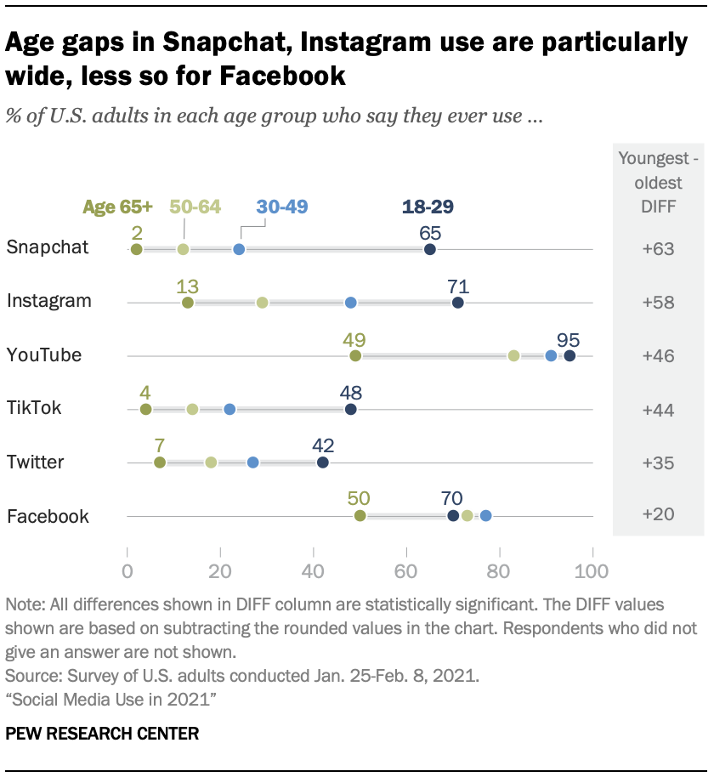
Percentages of social media use by age group from January 25 to February 8, 2021.
Consequently, web and social media platforms represent a goldmine of information that can be extracted using a variety of analytical tools. Some digital data points worth gathering include:
Engage inward
Want to know which issues are most important to potential enrollees?
Your institution just accepted a whole new class of students. Use them for guidance.
Need some inspiration? Set up one-on-one interviews, ask for feedback via email (you can even offer up a gift as an incentive), or conduct a Twitter poll. New students can provide a fresh perspective on admissions practices, if only because they’ve recently experienced them firsthand.
Test, test, and test some more
Savvy admissions officers like Joy McClure of Tricoci University support their marketing programs with split or A/B testing, stockpiling data by recording consumer activity for two separate iterations of a landing page, photo slideshow, satisfaction survey, or any other promotional asset.
Testing is crucial for tracing and anticipating user trends. With this in mind, McClure employs A/B test results to determine which of her team’s marketing methods are most impactful: from text message subject lines to call-to-action button displays, image placement, and beyond.
“Testing allows us to provide customized messaging based on behaviors that will hopefully…improve engagement,” McClure says, adding, “It doesn’t matter whether we like it; it comes down to performance.”
Cold, hard data never did anyone much good on its own. After you’ve collected all relevant info applicable to your institutional goals, be sure to:
Enter your details and we'll send you a quick confirmation email to verify your address.


 4 Experts Discuss Strategies to Achieve Ambitious Enrollment Goals [Webinar...