


SALES
How To Create Your Own Sales Dashboard?
Contents
Closing a sale is one of the most important parts of running a business but it’s not the only thing you need to focus on. Guiding leads to that final step is just as important, and knowing where every lead and salesperson is within that process can provide great benefits.
There are a number of pre-built solutions for this task and most will provide you with as many statistics as you could ever need. Unfortunately, the reality of the situation can easily get lost in the numbers.
The saying, “you can’t see the forest for the trees” is applicable here – you can see hundreds of trees around you, but you are unable to see the forest they make. Similarly, you can see hundreds of statistics about different aspects of your business, but struggle to relate those numbers to the business itself.
While it’s great to have access to as much information as possible, it’s even better to be able to see it how you want to.
LeadSquared provides robust reporting with all the information you could need to effectively run your business. Just like any other platform, you could suffer from information overload, but fortunately, LeadSquared allows the creation of custom dashboards that show you only what you need to see.
But that choice is not made by LeadSquared – you get to choose what information to see, and where you want to see it.
Every business is different and has different requirements, and every business owner is just as unique, if not more so.
On logging in to LeadSquared for the first time, a dashboard is already set up. There is very little information on it as this is your first time logging in and there is nothing personalized to your needs yet. However, simply tapping the button to create a new dashboard sets you on your way.
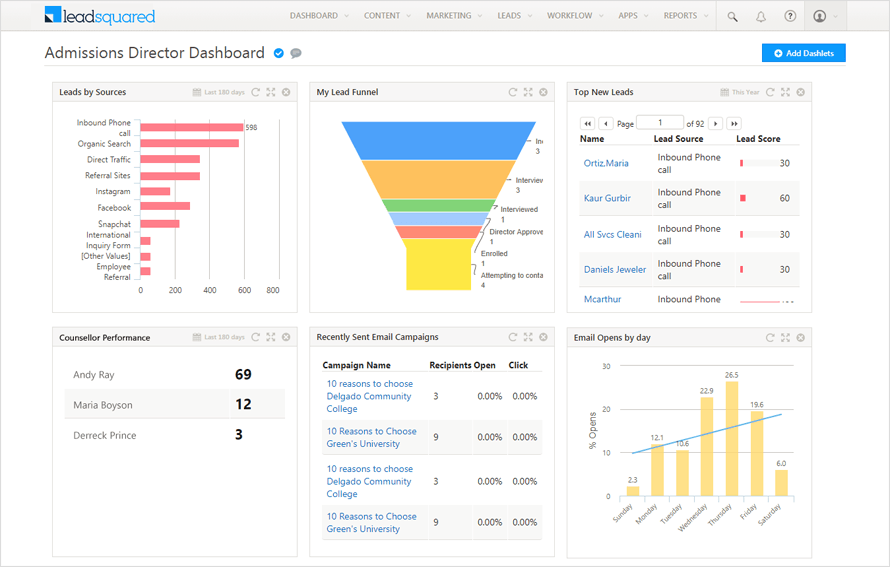
Dashboards within LeadSquared are built from elements called Dashlets. Each Dashlet provides a link or information relating to a particular aspect of your business as monitored by LeadSquared.
By building a dashboard that includes the reports that you need to see without any excess data to confuse the picture, you’ll instantly feel in control of your business and of your sales process.
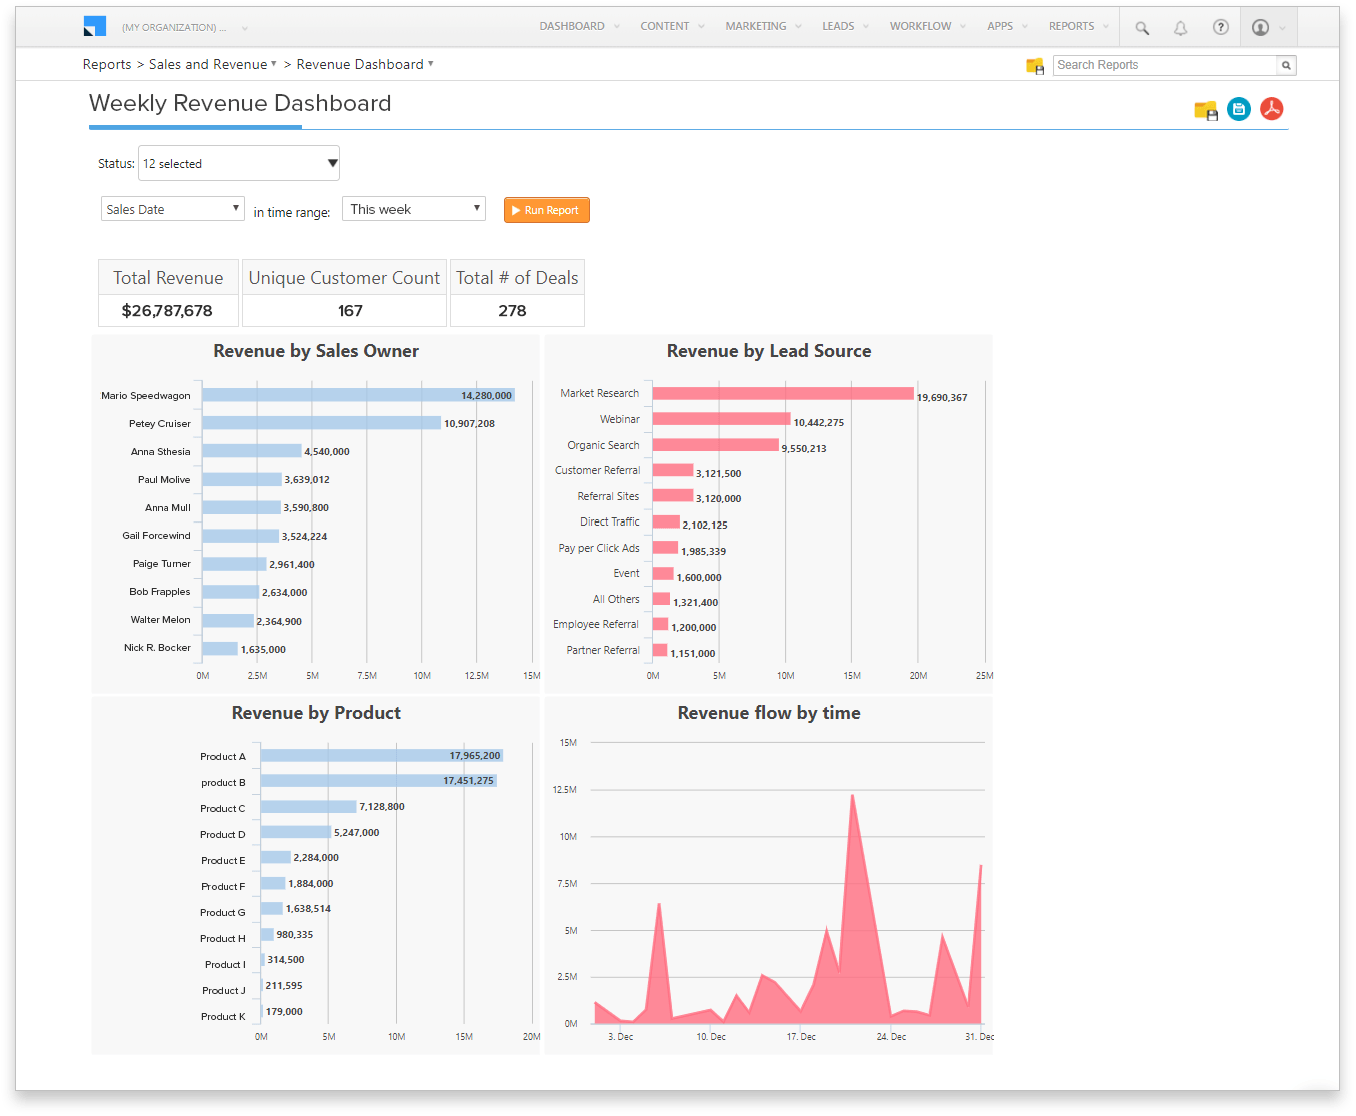
In your customized Sales Dashboard you can simply show which resources are bringing sales, which salesperson is making sales, which product is the best seller, where new opportunities may lie, where your leads are within the sales pipeline, sales forecasts, and more besides.
The beauty of it is that you don’t have to see all that information if only some of it is relevant to you, simply put your dashboard together just as you want it.
Your Sales Dashboard can include multiple reports, but the most useful include facts and figures relating to the amount of income for your business, where it came from, and how much more income is expected in the near future.
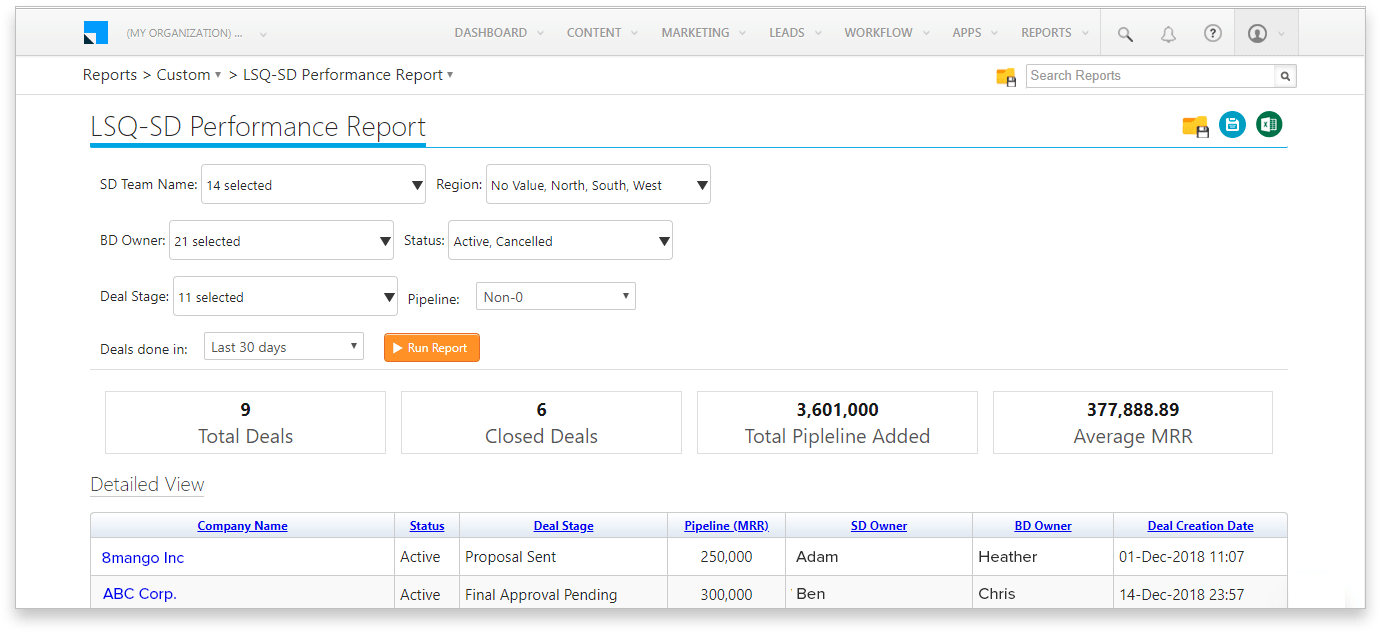
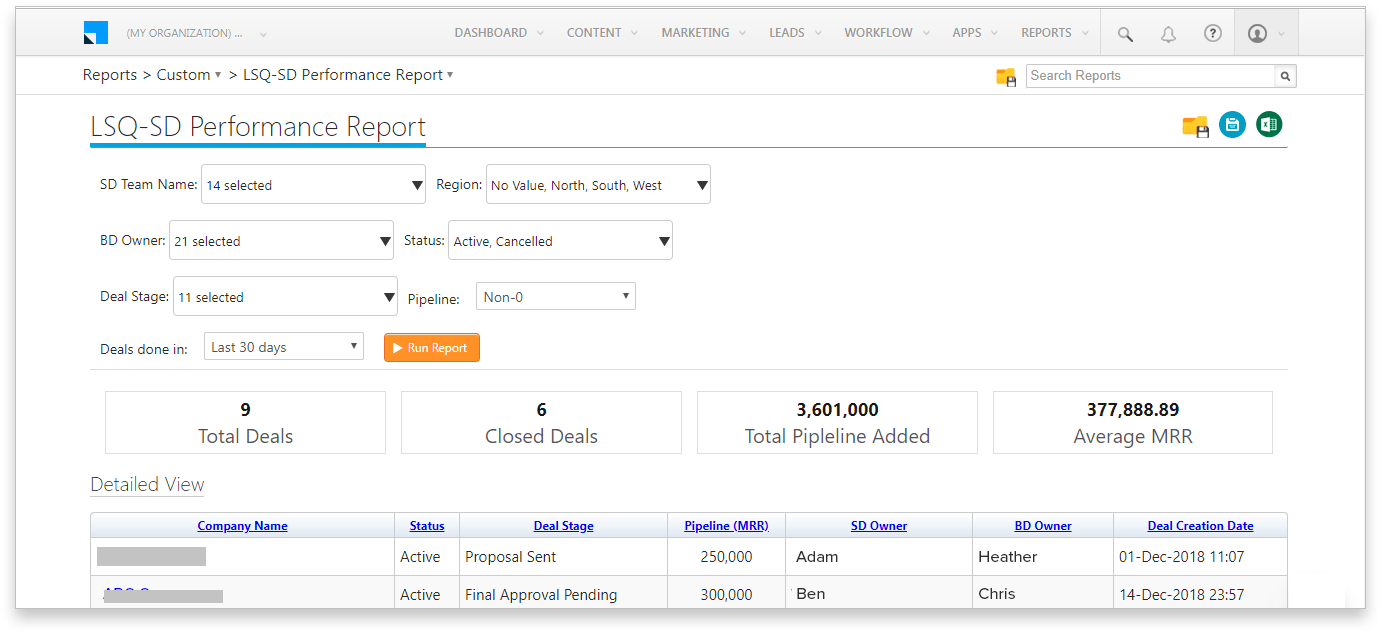
One of the better examples of this is the Sales Pipeline report. You might not consciously use a sales pipeline within your business, and might even be wondering what a sales pipeline is. It is simply the process that takes an interested lead and turns them into a paying customer.
The sales pipeline report allows you to filter the results by a variety of factors including the salesperson, a date range, where the lead originally came from (via a website? From a PPC ad? Etc), and so on.
The report monitors the status of leads with relation to a number of predefined steps that the salesperson would use to close a deal. This includes making calls, sending emails, scheduling and attending meetings, sending a quotation, etc. The further through this process that each individual gets, the more likely a deal is to be closed.
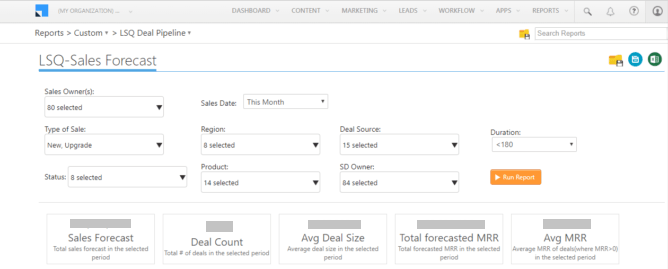
Based on this information, as well as the current and past performance of the salesperson, statistics can be calculated and shown to provide the most relevant information. The number of deals made during your filtered time period can be shown along with the average sale price of the deal. All of this information can be used to project a sales forecast, giving you an indication of where your business is heading.
Graphs and charts are included to allow you to visualize these numbers over a period of time, giving even greater clarity as to the direction the business is heading in.
The filtering system enables you to compare the performance of members of the sales team, or alternatively by region or location. If one team member or location is underperforming, you are well-equipped to take action to improve the situation before it becomes critical.
Further, you can spend your money where you need to, rather than guessing. The lead source filter shows you where your best-converting leads come from, and you can make an informed decision on whether you want to invest further into a particular source or to concentrate your efforts elsewhere. Even if the investment is not financial, you can establish the best place to focus your efforts to bring in new customers.
Running a business without tracking and monitoring how the business is performing is like taking a trip to an unknown area without using a map. If you’re lucky you might get to where you want to be, but the chances are you’ll end up broken down at the side of the road in the middle of nowhere without a clue how to get back on the right track.
Sales reports tell you what is working, and more importantly, what isn’t working. You are given the opportunity to make changes and improvements before you find yourself stuck without options, and you can see where the greatest sources of income are.
This gives you an almost psychic-like ability to predict future income and performance, and you can steer your business in the right direction to make the best of everything you have.
Of course, this only works if you can have the right information presented to you just as you need it, which is something that LeadSquared excels at.
Enter your details and we'll send you a quick confirmation email to verify your address.


 What is Sales and Marketing Automation?