


EDUCATION
Top 12 Education KPIs To Drive More Enrollments in 2026
Contents

Often higher education institutions rely on manual efforts to capture insights from excel sheets and pdf reports. But when it comes to making sense of enrollment rates, inquiries, and capturing prospects – there are multiple aspects that need to come together.
That is where measuring a finite number of education key performance indicators (KPIs) will provide better insights and help in admission-related projections.
There are several KPIs that can be considered, and we’ve narrowed it down to the top 12.
In this article we will highlight most important education KPIs that should be tracked across different stages in your admissions funnel. These insights will help you create a strategic plan to drive enrollments in the upcoming admissions season.
Let us look at why KPIs are important to be tracked throughout your admissions process.
Education KPIs help you quantify the goals you have set for different parameters to drive enrollments. They help you in course corrections, projections, and track how far you are from achieving the admissions targets that you have set.
For example, if you are tracking the number of calls connected per counsellor, you will be able to benchmark the minimum number of calls each counsellor should make in order to meet their quota of applications.
Before we start tracking our KPIs, we will need to set S.M.A.R.T goals to set the baseline of our reports. It stands for Specific, Measurable, Attainable, Relevant, Time-bound.
So, just a statement like “I want to improve enrollments this year” isn’t a SMART goal. It should be as specific as “I will 3x website visits to improve enrollments by 10% this year”:
Once you have your goals in place, education KPIs provide you with the means to get there. Here’s what they help you achieve:
As mentioned before, your KPIs will differ based on the stage of the enrollment funnel. Broadly the funnel is divided into – prospects, inquiries, applications, extended admission letters, deposits, and completed enrollment.
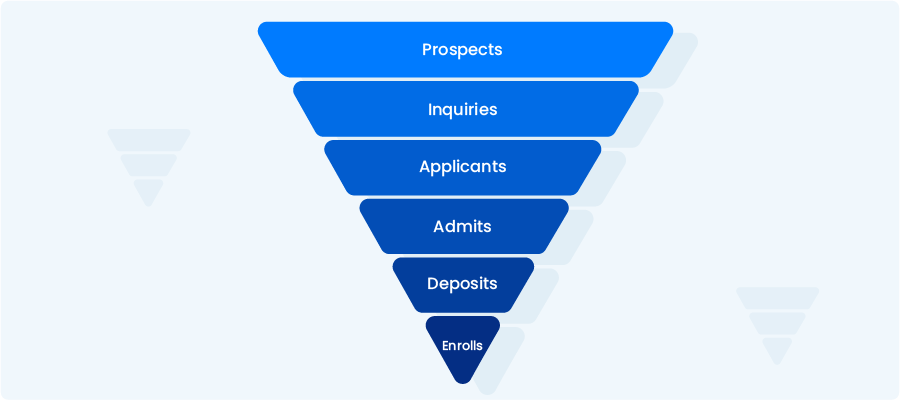
Let’s look at the most important KPIs that higher education institutions should measure at every step of the funnel.
These include the number of website visitors that come to your school’s website. They might necessarily share any contact information, but it is sure that they are interested in your content.
It is also an indicator of how well your courses, content, and school is getting discovered by your target personas.
You will be able to track these insights on Google Analytics and set website traffic related goals for your institution based on enrollment and conversion targets.
If you are on position #1, you are likely to get 10X clicks as compared to if you are on position #10. Hence, monitoring your search positioning and tweaking your SEO strategy is a goal you should have.
There are various monitoring tools like Semrush and Ahrefs that can help track average positions as well as get insights on what type of content to publish.
Your search position as well as the clicks you get will affect the number of visitors on your website and their conversion rates.
Now that you have a steady flow of visitors, you need to track the number of visitors that fill in the inquiry form. Landing pages are a sure shot way for you to convert the traffic to leads and tracking these conversions will help understand where you’re losing out on capturing student leads.
Based on landing page conversions, your counsellors can initiate contact with the prospects.
Monitor aspects like form fills and drop-rates to improve your landing pages. For example, you discover that you have the most drop-offs after the second fold, so you can either make the page shorter or improve the content further.
You can use tools like – Hotjar heat maps to understand the visitor behavior and clicks. And a marketing automation platform like LeadSquared can help you capture and track leads from each landing page.
Here’s how you can calculate Landing Page Conversions:

Once the prospect has shared their information, they get converted to an inquiry. At this stage, the intent of the prospect is clear. This is a crucial point of intervention, hence keeping close tabs on how these are performing is important.
The below mentioned metrics will help you track how your prospects are moving down the funnel as well as quality of those –
Track and minimize the student response time you have for an incoming inquiry. A 1-minute response time improves your chances of conversions by 391%!
Automation and drip campaigns will be your best friends to improve this metric.
Higher education is a highly competitive market, and no student is pursuing one single university. It becomes imperative for counsellors to take an omnichannel approach to reach these inquiries and close them as quickly as possible.
With LeadSquared, different activities are pushed based on the process you follow for your admissions. For example, if a counsellor got assigned to an inquiry, a task will be created to call the inquiry and once the task is completed, you can get visibility through call dispositions.
By setting automated updates like calls connected or ‘did not pickup’, student stages will be updated along with timestamps and date.
You will be able to calculate an average turnaround time (TAT) basis these timestamps and activities in the form of custom reports.
Using CRM tools like LeadSquared will help you automate assign counsellors, create follow-up tasks and track conversations that happen throughout the student’s journey.
An inquiry has started to fill out the application form but is stuck on step 3 and couldn’t submit the application or missed the deadline.
If your counsellors got notified in real time and can respond and resolve their query quickly, the chances of that student not completing the application are nullified.
Tracking student drop-offs help you ensure that each application is completed and you can identify what causes the student leads to leak out of the funnel at this stage.

An Education CRM can help you receive real time notifications and capture the activity at which the student is stuck.
These metrics help you understand the rate of conversions from inquiries to applicants. It helps identify the leaks in your funnel and plug them to ensure a steady stream of applications.
Once the student has applied for a particular course, there might be several eligibility criteria they will have to clear before an offer is made. One of them being an entrance test.
If you are taking these tests through an online platform, it is important to track:
- The number of students that attempted the test.
- The number that passed
- The number of applicants that qualified for the test
At every stage, the student will require your counsellors to help them out. So, the counsellors need to be in touch with the applicants to ensure that they take the test to improve quality metrics of applicants.
After successfully qualifying the entrance test, the applicant moves to personal interview stage. Again, like the entrance test you need to keep track on the interviews attended vs non-attended.
At this stage the student as well as the counsellors have put in significant efforts, so it is important to minimize leaks at this stage.
Here, sending out automated reminders, sharing content on how to prepare better, scheduling mock interviews can prove beneficial for minimal no shows.
The very last step in the student journey is collecting the necessary fees and payments. This is when you get visibility of the incoming revenues for the university.
Once the student has qualified the interview round, their admission is confirmed. The counsellors need to guide them through the various payment options and ensure collections.

Metrics like percentage of scholarship students, full-time students, part-time students, and 100% tuition paying students will help in projecting the revenue for the current as well as upcoming years.
For example, if your goal states that revenues will increase by 25% this academic year, then identifying opportunities from current and incoming students will help you drive that goal to its completion.
Here a few marketing KPIs that will help universities identify key performing channels, counsellor efficiency, etc to drive more enrollments.
Capturing the return on money spent across channels like performance marketing, third-party vendors, as well as campus or course performance will help you identify your focus area for admissions.
For example, if you have a break-up on historical enrollment or inquiries, we can identify how each channel has performed.
Metrics like percentage contribution of each source or number of seats filled will help you judge the quality of your marketing spends.
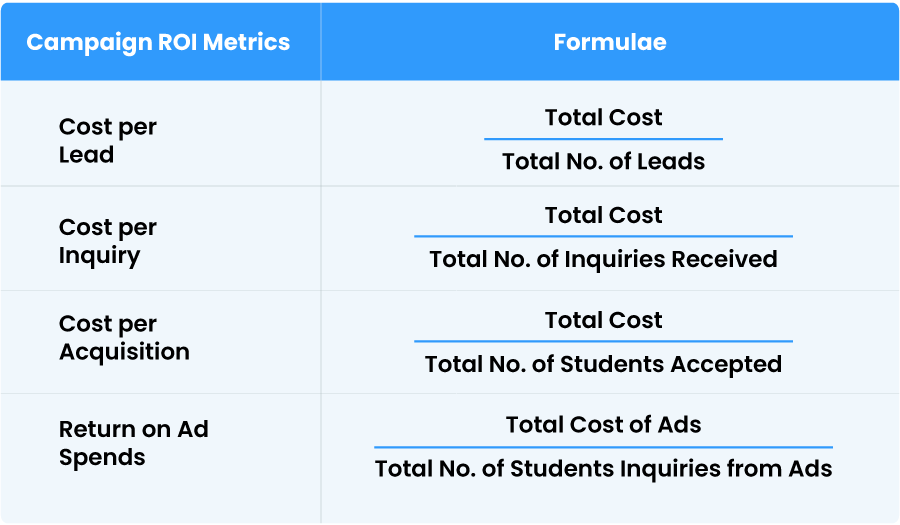
Here’s a list of metrics that can help you find your campaign ROI and channel performance –
Every university will be having certain partners like Collegedunia, Shiksha, to help them get more student inquiries each year.
In order to track their performance, monitor metrics like:
1. Number of publisher queries to number of verified publisher queries (the student has verified their phone number via OTP)
2. Cost per query
3.Number of publisher queries that enrolled in the course.
Looking at these multiple metrics you will be able to judge the quality of your publisher partner and invest in the ones that make an impact in driving enrollments.
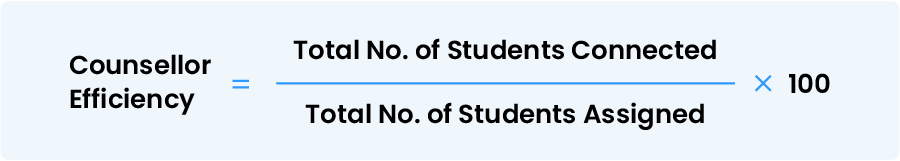
Counsellors are the nervous system of an institution. They are generally the first human contact that prospects have. It is important for you to track their efficiency to see the impact on conversions.
You can measure counsellor efficiency by setting benchmarks for counsellor performance. The metrics that you can track include:
1. Number of assigned inquiries per counsellor
2. Number of daily connected calls
3. Inquiry-to-applicant ratio
4. Application-to-enrollment ratio
5. Daily talk time
6. Monthly conversions
And many other metrics, which are relevant to your business. Keeping a check on these numbers will help you gauge how your team is performing at each stage.
If you’re wondering, “How do I track counselor performance daily, weekly, and monthly?”, the answer is pretty simple.
You can track counselor performance using LeadSquared Education CRM by monitoring real-time dashboards and automated reports. Daily tracking covers lead follow-ups, calls, and task completion; weekly reports highlight conversion rates, response times, and pipeline movement; and monthly analytics provide insights into enrollments, revenue contribution, and overall counselor productivity—all in one unified view.
This will help you identify how your teams, departments, courses, and campuses are performing each year. It is an important metric to track from a strategic point of view by conducting trend analysis.
For example, if you see a trend that a lot of students are inquiring about course X, then you can scale down the marketing efforts and pursue to market other courses that aren’t doing so well.
You can start seeing a trend once you have enough enquiries coming in each year and there is a steady increase in the volumes.
This metric will also give you insights into market sentiments. So, if in year 3 you see a dip in the number of incoming inquiries, and there was a policy factors that affected that dip, tracking this will help you understand the effects of external factors as well.
By the end of this article, I hope you have better insight into what are the different education KPIs that need to be tracked across the student enrollment journey. It is important to track at least these KPIs to ensure a tightly run enrollment season.
And you don’t need multiple platforms to track a majority of these KPIs. An end-to-end admissions platform like LeadSquared can help you make that process easier by compiling a centralised picture of all your incoming inquiries.
Would you like to try out LeadSquared?
Not every KPI carries the same weightage for every institution. The right KPIs depend on factors like program mix, student demographics, enrollment goals, and competition. Institutions should prioritize KPIs that directly influence decision-making rather than tracking everything available. For example, a university struggling with lead quality may focus more on inquiry-to-application ratios than raw traffic. Regularly reviewing KPIs against strategic goals ensures teams stay focused on outcomes, not just activity. A smaller, well-aligned KPI set is often more effective than an extensive dashboard.
Tracking KPIs only adds value when insights lead to timely action. Some KPIs, like response times or application drop-offs, should be monitored daily or weekly to enable quick intervention. Others, such as year-over-year enrollment trends, are better suited for monthly or quarterly reviews. Establishing review cadences helps teams avoid reactive decision-making while staying agile. Consistent KPI reviews also create accountability across admissions, marketing, and leadership teams, ensuring everyone understands how their efforts impact enrollment outcomes.
A frequent mistake is evaluating KPIs in isolation without understanding their context. For example, higher website traffic may look positive but mean little if conversion rates decline. Another issue is focusing only on lagging indicators like enrollments, rather than leading indicators such as inquiry quality or response speed. Institutions may also overreact to short-term fluctuations instead of identifying long-term trends. Proper interpretation requires connecting multiple KPIs across the funnel to understand cause-and-effect relationships before making changes.
Accurate KPIs depend on clean, consistent data across systems. Manual data entry, disconnected tools, and inconsistent definitions often lead to unreliable reporting. Institutions should standardize KPI definitions, automate data capture where possible, and regularly audit reports for anomalies. Using a centralized admissions or CRM platform reduces duplication and errors. Data accuracy also improves when teams are trained on proper usage and understand why accurate reporting matters for strategic planning and forecasting.
KPIs are not just operational metrics for one admissions season; they are strategic tools for long-term planning. Over time, KPI trends reveal shifts in student behavior, channel effectiveness, and program demand. These insights help institutions plan capacity, refine offerings, and allocate budgets more effectively. Longitudinal KPI analysis also enables scenario planning and risk mitigation. Institutions that use KPIs consistently over multiple cycles gain a clearer understanding of what drives sustainable enrollment growth.
Enter your details and we'll send you a quick confirmation email to verify your address.


 Design Your Perfect Patient Engagement Program for 2026