


SALES
How To Create A Customer Journey Analytics Dashboard (Tools Included!)
Contents
B2B customer journeys are complex. The average sales cycle can last more than 4 months. They involve several stakeholders and touchpoints across campaigns, websites, sales initiatives, and more.
It’s no wonder that 77% of B2B customers find the act of buying difficult. It’s hardly any easier for B2B sellers.
With customer journey analytics dashboards, it doesn’t have to be this way.
This article explores what customer journey analytics is and why it’s important. We also discuss a step-by-step process to create a customer journey analytics dashboard. And in conclusion, we highlight 7 customer journey analytics software for your consideration.
A customer journey analytics dashboard is a tool that tracks and visualizes customer touchpoints. It improve sales and marketing performance, customer retention, and business growth.
Customer journey analytics software track and improve conversions. They unify data across campaigns, websites, and products. This, in turn, refines the customer experience at every stage of the sales cycle. Building a customer journey analytics dashboard has a couple of other benefits. Let’s take a look at them.
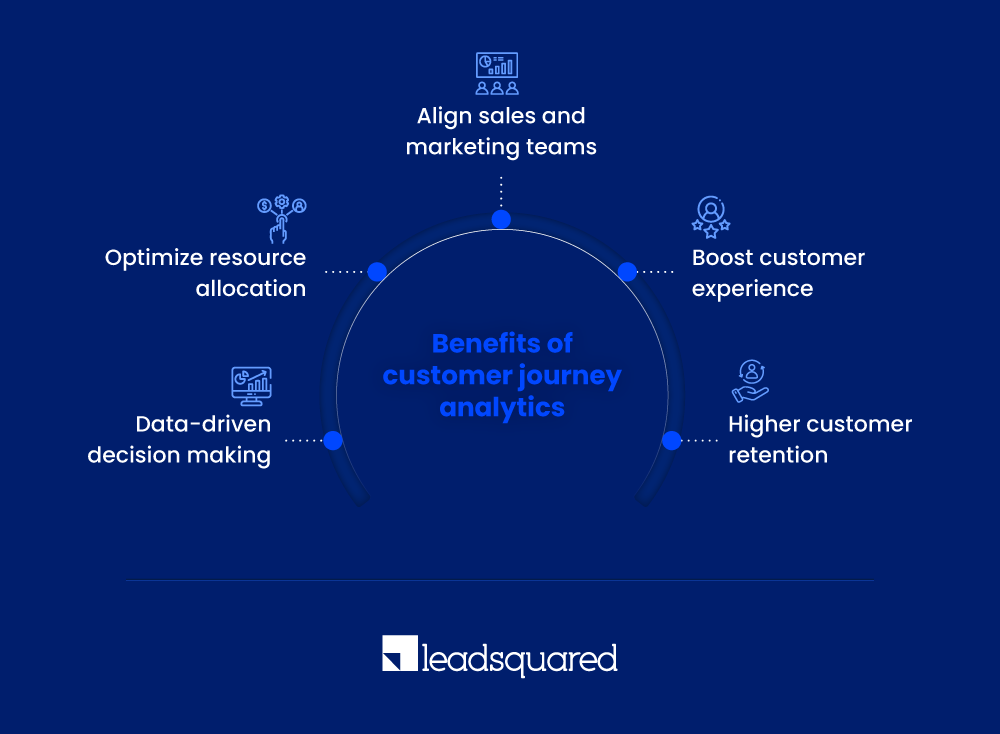
There are several benefits of customer journey analytics, such as:
Customer journey analytics provides data-driven insights into customer behavior. Rather than relying on intuition or guesswork, journey analytics quantifies what influences conversions.
Measure the value of every customer touchpoint on conversions. This reallocates budgets and efforts towards initiatives that drive results. In turn, it optimizes resource allocation and reduces budget leakage.
Achieve end-to-end visibility into how leads are progressing along the customer journey. This shared view of the buying process helps reduce siloed data and promotes go-to-market alignment.
Once you have visibility across the customer journey, you’ll be in a better place to identify points of friction that need refinement. Customer journey analytics help you track every point of contact, channel used, and buyer stage visually on a single dashboard.
The benefits of customer journey analytics extend beyond converting leads to customers. It also helps you understand product usage, engage with existing customers, and bolster customer loyalty.
Although they’re related, customer journey analytics and mapping are different concepts.
Customer journey mapping refers to qualitative visualization of customer touchpoints while customer journey analytics relies on quantitative data for behavioral insight. Here’s a detailed breakdown of the differences between the two:
| Point of comparison | Customer journey mapping | Customer journey analytics |
| Definition | Visualization of the customer journey. | Data analytics of the customer journey. |
| Purpose | Intuitively understanding customer experience to identify points of friction. | Data-driven measurement of customer journey to optimize touchpoints and improve engagement. |
| Method | Involves Qualitative research and it may include surveys, interviews, and subjective observations. | Quantitative analysis using data mining, testing, and statistics. |
| Results | Diagrammatic illustration of customer journey timeline. | Numerical metrics and insights into conversion rates, points of drop off, and other customer behavior patterns. |
It helps to use both customer journey mapping and customer journey analytics in tandem. This provides a better sense of customer interactions with your company.
So far, we’ve discussed what customer journey analytics is and why it’s important. But how does one go about putting together a customer journey analytics dashboard? Let’s find out:
Customer journey analytics relies on customer data. It’s key to connect the dots between marketing, sales, product, and customer support.
Accordingly, the first step involves integrating campaigns, social media, website, and CRM data. This can be tedious and time-consuming to do manually. Luckily, several off-the-shelf tools, like LeadSquared, offer no-code solutions to integrate data together.
Once the relevant data is in place, teams must decide what metrics and KPIs matter the most.
Customer journey analytics dashboards should be as intuitive as they are comprehensive. Loading up several irrelevant KPIs will result in convoluted dashboards. Here are a couple of common reports to consider including:
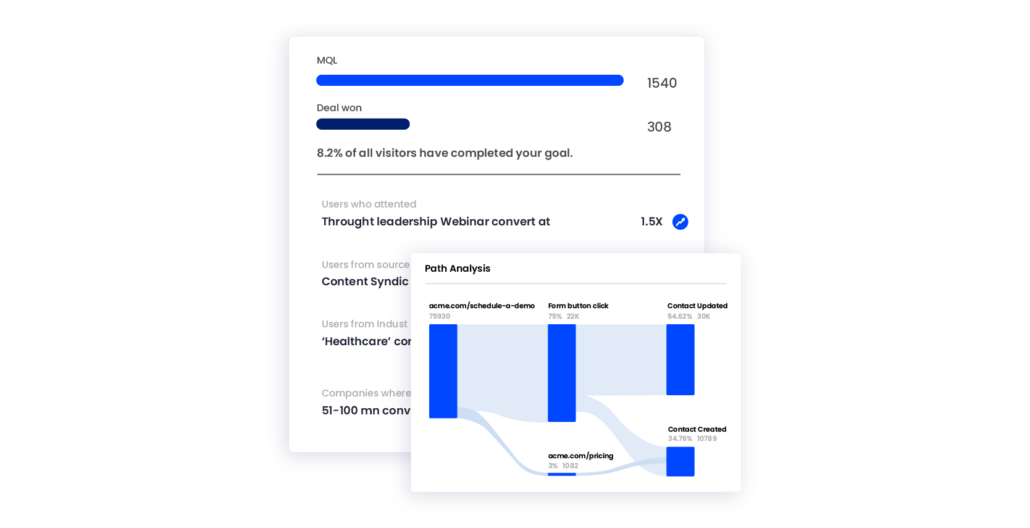
A marketing funnel provides a bird’s eye view of customers in the sales cycle.
B2B sales cycles are lengthy and, on average, involve at least 6 decision makers. It helps to keep track of the speed at which leads are moving along the sales cycle. For one, this helps gauge expected sales pipeline. For another, it sheds light onto which stage of the sales cycle is taking longer than necessary.
Your website is receiving voluminous traffic, but where are visitors coming from?
And more importantly, where are ICPs coming from? Social posts, search ads, or events? Connecting the dots between campaigns, web, and CRM helps answer these questions. It allows teams to refocus efforts towards initiatives that work best.
Conversion rate measures the percentage of prospects moving through each stage of the sales funnel. It helps identify disproportionate points of drop offs that might indicate areas of improvement.
We’ve established that customer journeys involve several touchpoints. Attribution analysis helps understand the influence of each customer touchpoint on conversions. There are several types of attribution models such as linear, U-shaped, and time-decay. Each model assigns credit to touchpoints differently, based on their recency and relative impact on conversion.
Customer churn measures the percentage of existing customers who stop paying for a product over a period of time. A high churn rate may indicate poor customer support, product shortcomings, or superior alternatives available in the market. It’s generally the product and customer success team’s responsibility to keep churn low.
So far, we have all our data and we know what we want to measure. Now, it’s finally time to leverage dashboarding tools for customer journey analytics. A few years ago it might have made sense to build dashboarding software inhouse. But these days, a wide range of cost-effective plug and play solutions cater to most use-cases. We’ll review a few popular tools in the next section.
Customer journey dashboards support powerful visualizations to pinpoint where leads are dropping off. By identifying where leads lose interest, teams can prioritize areas of improvement.
The last step is to experiment with marketing, sales, and product initiatives. It’s important to monitor performance with the dashboard. Data-driven iterations will help make gradual improvements to conversions, retention, and customer experience.
Now, let’s review a few analytics tools that help businesses track and improve the customer journey.
There are several tools that help track, analyze, and optimize the customer journey. Let’s review 7 of them:

LeadSquared is a robust customer relationship management and marketing automation platform. It provides lead tracking, customer data platform, and revenue reporting features amongst others.
CRMs like LeadSquared are essential for customer journey analytics. They act as the single source of truth for most customer data across marketing and sales efforts.
Key Features
Pricing
LeadSquared offers three packages that differ based on the features offered. The Lite plan $25 per user/month while Pro costs $50 per user/month and Super is proced at $100 per user/month. Businesses can also request for a custom pricing plan based on the features that they require.

Factors is an AI-fueled account analytics and multi-touch attribution platform. It unifies customer data across campaigns, website, and CRM to report KPIs and insights. Factors offers a range of power customer journey analytics features including:
Key Features
Pricing
The package starts at $99/month for visitor identification. Journey analytics and attribution plans start at $399/month. The pricing depends on the number of monthly visitors.

Hotjar is a behavior analytics and feedback tool. It helps businesses monitor user behavior on websites and mobile applications. Hotjar is useful for product marketers and UX teams. It improves website performance and conversion rates.
Key Features
Pricing
Hotjar offers a free plan for up to 35 daily sessions as well as unlimited heatmaps. Its paid plans start at $35/month for 100 daily sessions and scales up based on the number of daily sessions.

MoEngage is a customer engagement platform that helps businesses with personalized, multi-channel communication. It’s used by a wide range of industries including SaaS, e-commerce, and finance to drive user engagement and retention. Here are a few key features:
Key Features
Pricing
Moengage does not reveal its pricing but offers two plans: Grow and Scale. Grow is better suited for smaller teams with limited budgets and use-cases. Scale is for enterprises with involved, multi-functional requirements. You can learn more by getting in touch with their team.

Customer journeys extend beyond the signing of the contract. Tracking post-purchase customer service can help you boost retention as well. Totango as a customer success platform, tracks and manages customer relationships with the following features:
Key Features
Pricing
Totango offers a free community plan. Its paid plans start at $249/mo for 200 customer accounts. Pricing scales with number of customer accounts, number of seats, and extra features.

Mixpanel is a leading product and event analytics platform. This tool delivers real-time customer journey insights to support data-driven decisions. Product teams, marketers, and data teams use Mixpanel to improve customer engagement.
Key Features
Pricing
Mixpanel offers a generous free plan for up to 20 million monthly events. This includes core user journey analysis features. Its paid plans start at $20/mo and can extend to more than $1000/mo based on the number of monthly events.

FullStory is a digital experience and product analytics platform. It helps users identify what’s working and what’s not across the customer journey. FullStory helps product teams, UX designers, and customer success teams improve customer experience
Key Features:
Pricing
FullStory does not reveal pricing but offers three plans: Business, Advanced, and Enterprise. Now that you have a couple of options to choose from, here comes the tough bit.
Every business has different requirements. While all the customer journey analytics tools covered provide comprehensive solutions, some may be better suited to your company than others. Here’s how to go about choosing the right tool for you:
1. Define needs: Start by identifying your business needs and objectives. What KPIs are you looking to track and optimize? What function needs to improve performance? It wouldn’t make too much sense to invest in a heat mapping tool like Hotjar when the issue you’re trying to solve for is churn. Instead, a customer success management tool like Totango would be a better option.
2. Assess integration capabilities: It’s important to avoid siloed data. Ensure that the tools you’re evaluating integrate seamlessly with your existing techstack. The ability to connect data from multiple sources provides a holistic picture of the customer journey and eliminates unnecessary developer dependencies.
3. Consider pricing and customer support: There’s a wide range of pricing models when it comes to customer journey analytics tools based on volume of data, number of users, and functionality. For instance, enterprise tools are chock-full of advanced features that may be redundant or overly expensive for smaller teams. Also consider customer success management and technical support for each tool to ensure long term compatibility.
4. UI and accessibility: A tool is only as useful as it is usable. Customer journey analytics is a relatively involved and technical concept. Prioritize tools with intuitive UI to ensure you receive actionable value. It should also be flexible enough to accommodate business-specific requirements like customer KPIs and dashboards.
5. Security compliance: Given that customer journey analytics involves sensitive customer data, it’s important to take security compliance into account. Industry-standard privacy regulations like GDPR and SOC2 must be met to ensure safety.
I hope this comprehensive guide helped you understand customer journey analytics and it’s benefits in detail. If you need any help choosing a tool to analyse customer journeys or would like to give LeadSquared a shot, you can schedule a demo today.
The purpose is to track, analyze, and optimize the customer journey from first touch to last. Customer journey analytics is valuable to marketing, sales, product, and customer success. It refines the customer experience, drive conversions, and improve retention.
There are several ways to visualize the customer journey. Here are a few common methods:
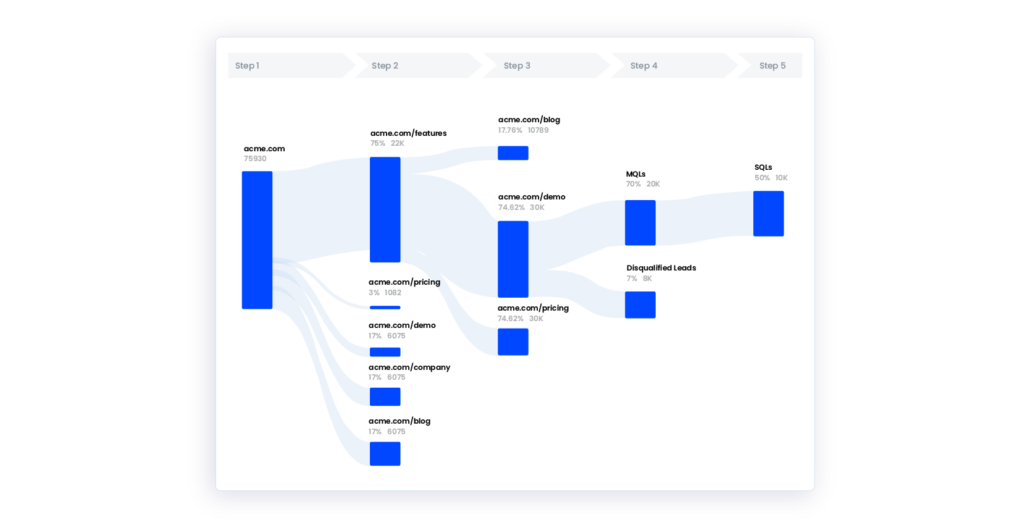
1. Path analysis: Path analysis tracks a sequence of events that lead to a conversion goal. They’re usually represented as a flow chart.
2. Heat-map: Heat-maps represent customer behavior and highlight points of high and low engagement. This helps UX teams see what parts of the website are intuitive or unintuitive
3. Account timeline: Account timelines are linear representation of the customer journey. They show account-level touchpoints that occur over a period of time.
Enter your details and we'll send you a quick confirmation email to verify your address.


 5 Ways to Leverage WhatsApp for Customer Service