- Home
- Learn
- Process Automation
- Top Digital Transformation KPIs You Need to Track in 2025 and Beyond
PROCESS AUTOMATION
Top Digital Transformation KPIs You Need to Track in 2025 and Beyond
Contents
Though businesses today are investing more money than ever before in digital transformation—it is anticipated that global investment will reach $3.9 trillion by 2027—the grim truth is that only around one-third of these programs are deemed effective.
Here’s the sobering truth: throwing money at digital transformation without precise measurement is like navigating in the dark. Before beginning transformation initiatives, companies that effectively define the outcome have a 3.5-fold higher chance of success.
The difference between digital transformation success and failure isn’t the size of your budget—it’s the intelligence of your measurement strategy. To make sure you’re headed in the right direction, you need to set and track the appropriate digital transformation KPIs.
Some of the insights shared in this blog are takeaways from a webinar featuring Malay Shah, Former Chief Growth Officer at LeadSquared. Shah shares his thoughts on digital transformation KPIs, among other things. With over two decades of experience in management consulting, he has held leadership roles at firms like EY, McKinsey, and Infosys. His expertise lies in large scale digital transformation and crafting go-to-market strategies that deliver measurable impact. In this session, he breaks down the most crucial KPIs for tracking the success of digital transformation in the following functions:
You can watch the webinar below or save time with our condensed takeaways that cover all the key points.
Note: While not all points originate from the session, several key observations do. Additional insights have been included to reflect current trends and best practices, offering a more up-to-date view of the landscape.
Customer experience is emerging as a crucial brand differentiator and is likely to surpass pricing and product in the near future. Whether interacting with brands online or in person, consumers anticipate a seamless and consistent experience across all touchpoints.
There were 806 million internet users in India at the start of 2025, accounting for 55.3% of the country’s population – and this number continues to grow.
This makes it essential for companies to prioritize exceptional digital experiences, starting with a clear understanding of how consumers engage with their brand online.
A typical customer journey begins when potential customers learn about your brand and continues all the way through to becoming loyal customers – or even brand advocates. In B2C, this journey has four defining characteristics:
This makes responsiveness vital to delivering great customer experiences. To boost engagement, ensure you’re present across all possible touchpoints. Just as important, your team must respond promptly to queries from every channel.
Below is an illustrative B2C customer journey, complete with definitive steps and KPIs to track at each step.
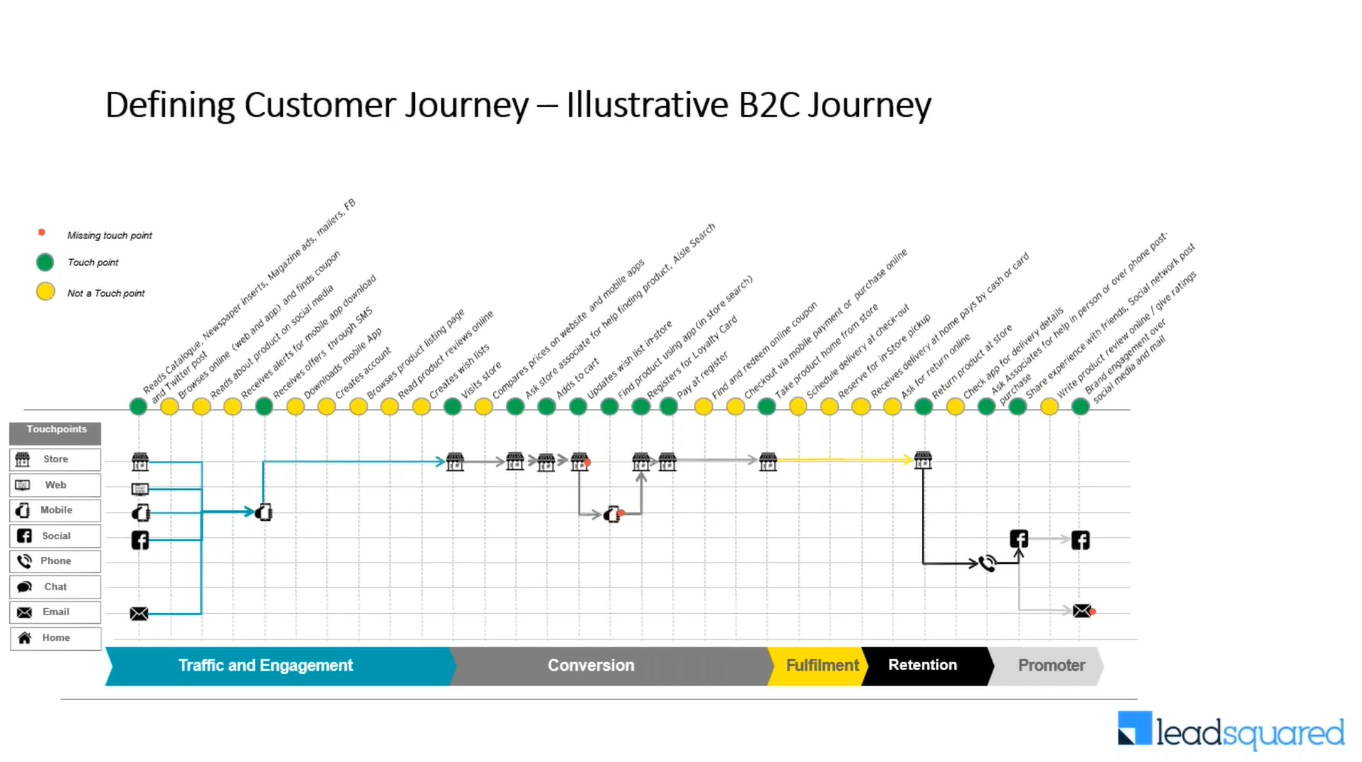
Here are some of the leading indicators that reflect how strong and effective that digital presence really is:
It’s critical to concentrate on metrics that demonstrate whether you’re successfully increasing visibility, engagement, and lead generation when assessing the performance of your digital platforms. Important areas to monitor are:
When you measure these metrics, try to figure out if you’re able to move the needle on a month-on-month basis, and in some cases, on a week-on-week basis.
Also, there will be several other brands offering similar products and targeting the same set of audiences. Therefore, building your digital presence becomes even more crucial.
Once you’ve built the traffic, the next thing you should do is measure the quality of traffic. That is, measure the quality of engagement you get from your consumers on those digital assets.
Customer engagement in today’s digital world extends well beyond simple clicks and visits. Real-time feedback, community involvement, content interaction, and retention are all aspects of multifaceted engagement. Here’s how to track it:
Engaged customers are more likely to convert. But most cart abandonment happens at the point of sale. So, you must track all the stages of the sales funnel and identify conversion rates at each step. Here are some of the metrics to measure conversions.
1. Click-Through Rates (CTR) at Every Stage of the Funnel
2. Qualified Engagements: Trials, Demos, and Appointments
3. Sign-Ups and Subscriptions
4. Performance & ROI Metrics
Go beyond vanity metrics with performance-based KPIs:
For holistic ROI tracking, integrate ad platforms with CRM tools (e.g., LeadSquared, HubSpot, Salesforce) and analytics platforms (e.g., GA4).
If you don’t measure the revenue generated from your digital channels, your transformation efforts risk becoming superficial and lacking true business impact.
Note that digital does not have to give you just an additional revenue stream. But it has to build an economy that’s differentiated. That’s why your cost per click, cost per lead, and customer acquisition cost on digital channels have to be less than the traditional ones. That is, you should be able to realize a much higher return on marketing investment through digital.
It is one thing to acquire a customer, and another to retain. Once you’ve won the customer, retention becomes the next most important factor in your digital customer journey, as it signifies the value they get from your offering.
2. Recurring Revenue Metrics
1. Net promoter score/NSAT or customer satisfaction rating
2. Cross-sell/upsell percentage, LTV
3. ARPA (Average Revenue Per Account)
The above metrics will help you understand if your business is moving in the right direction – from a customer experience standpoint.
Next, we move on to the operational metrics to determine if you’re on track for sustainable economics.
Your business spans multiple universes—sales teams chasing targets, marketing crafting campaigns, customer service solving problems, operations keeping the wheels turning. Here’s the reality check: an estimated 90% of organizations are now undergoing some form of digital transformation, but only the smart ones understand what this actually means.
Digital transformation isn’t about replacing your people with robots—it’s about giving your team superpowers. The key? It automates repetitive, low-value tasks so your people can focus on work that truly matters.
Below are some of the metrics that you should track to measure your sales effectiveness.
1. Revenue per Sales FTE
2. Cost per Demo, Visit, or Call
3. CAC, LTV:CAC Ratio, Bessemer Efficiency Ratio
4. Average Time Spent on Lead Activity
5. AR Aging & Payment Cycles
Metrics like revenue per sales rep, cost per demo, etc. will depend on a number of factors. For instance, type of sales (field or inside sales), marketing channels, etc. But there are standard methods of calculating CAC, Bessemer ratio, as described below.
You can find CAC by dividing all costs associated with acquiring new customers by the number of new customers acquired during the period in question.
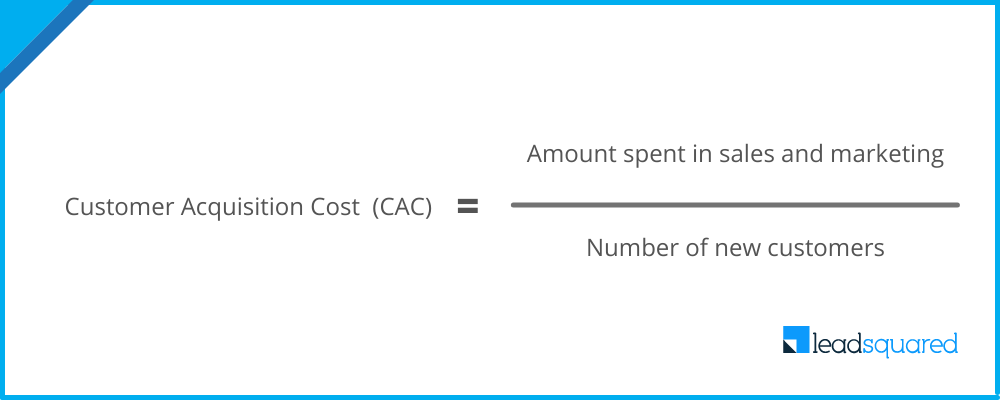
For example, if you spend $1000 on marketing and sales and acquired 1000 customers, your CAC will be $1.00 during this time.
The Bessemer CAC Ratio is mostly applicable to subscription-based products. It tells you how quickly your gross margin covers your new CAC.
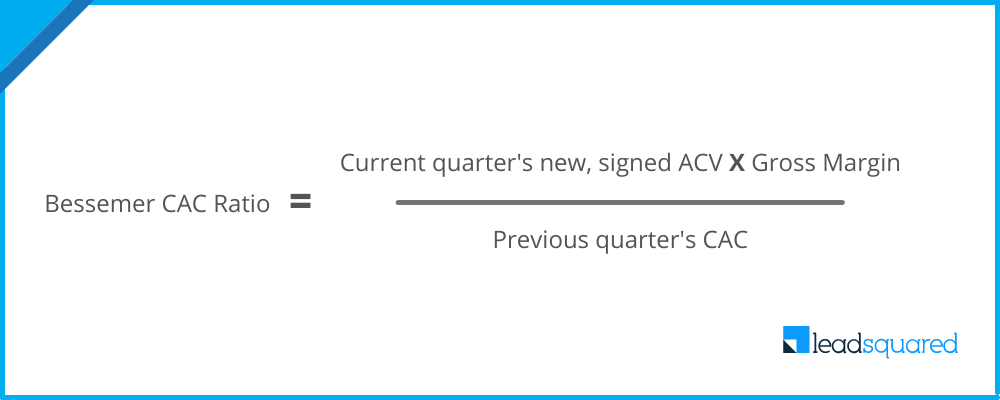
Where ACV is the annual contract value and Gross margin is a company’s net sales revenue minus its cost of goods sold.
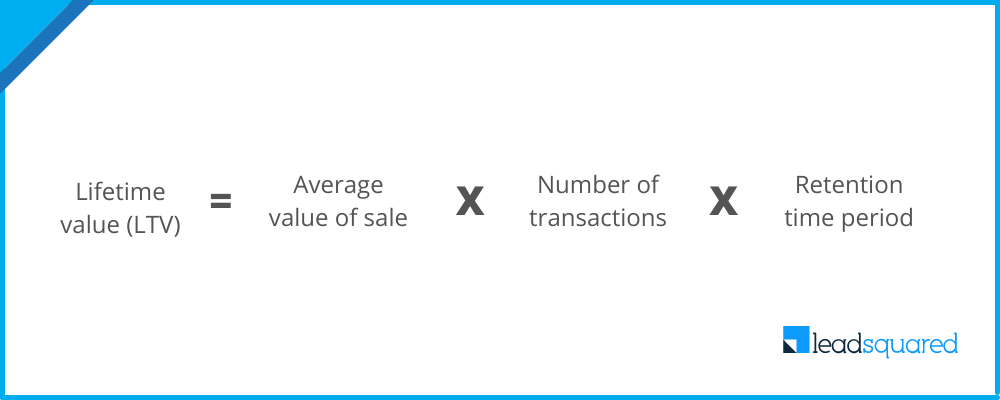
To measure LTV, you can use the following formula. LTV (Lifetime Value) represents the total revenue a customer is expected to generate during their relationship with your business. It should be higher than your CAC (Customer Acquisition Cost), indicating that your sales and marketing efforts are profitable and efficient.
To improve your sales operations, assess the processes you can improve with automation. For instance, LeadSquared’s automation for sales and marketing departments can help you with:
1. Lead Capture and Distribution
This is to automatically capture and assign leads to the right sales rep. The software segregates them based on our chosen criteria, such as region, language, expertise, and more.
2. Automatic follow-up notifications
This is to send notifications to sales reps whenever a lead enters the funnel. This way, they can respond to them faster and get higher chances of winning the deal.
3. Lead activity tracking
Activity tracking helps gauge the prospect’s interest in the product/service and prioritize accordingly. By assigning a specific score to a lead, sales reps can focus on the most active ones and reach out to them first.
4. Reports and analytics
Automated reports on every lead’s activities help figure out what method of marketing works best, whether there are any gaps in the sales funnel that need fixing, what your sales reps are doing right and wrong, and so on. There are over a hundred ready-to-use automated reports available in LeadSquared CRM.
Now, if you look at the core operations, the following metrics can help.
Core operational metrics:
1. Time to onboard a customer
2. Order management cycle time and stages
3. Support costs as % of revenue
4. Cost per order
Want to dive deeper into operational KPIs based on your industry?
Read this: Operational KPIs Across Industries: Essential Metrics For 2025.
Next are the supply chain metrics.
Supply chain metrics:
1. Cost to fulfill an order
2. Number of lines auto planned
3. Days of inventory
From a back-office perspective, you can consider the following financial metrics.
Finance metrics:
1. General and Administrative (G&A) costs as % of revenue
2. Days of closing your books (on a monthly/quarterly basis)
3. PSAT or partner satisfaction (vendor satisfaction)
3. Error %
Also, HR metrics are important when you consider overall operations in your organization.
HR metrics:
1. Time to onboard an employee
2. Revenue per FTE
3. Attrition percentage
4. ESAT or Employee satisfaction
Note that depending on the industry, the metrics may vary for organizations.
Next, let’s move on to Business Model Innovation.
The ultimate test of your digital transformation isn’t just operational efficiency—it’s whether you can turn technology into a profit engine. The question that should keep every executive awake at night: Can we use digital innovation to create entirely new revenue streams that didn’t exist before?
Create a business model that allows innovative products to shine. At the same time, find new ways to increase revenue and decrease time spent working.
In terms of business model innovation, here are some KPIs:
Business Model Innovation KPIs:
Sales model innovation:
1. Revenue from new products, offerings, and services
2. Revenue from new channels
3. Revenue from new partnershipsNew product introduction:
1. Rate of new product introduction or the pace of innovation
2. Number of epics, story-points, user stories
3. R&D cost as % of revenue
Design and engineering:
1. Cost of poor quality
2. MTTR (Mean time to repair), MTBF (mean time between failure)
3. Percentage security or performance incidents
Platform:
1. Cloud and mobile readiness
2. Platform elegance
3. Platform agility
4. Platform resilience
5. Technical debt
By tracking these metrics, you gain a clearer picture of how digital initiatives translate to tangible business results, ensuring your innovation efforts are both measurable and meaningful.
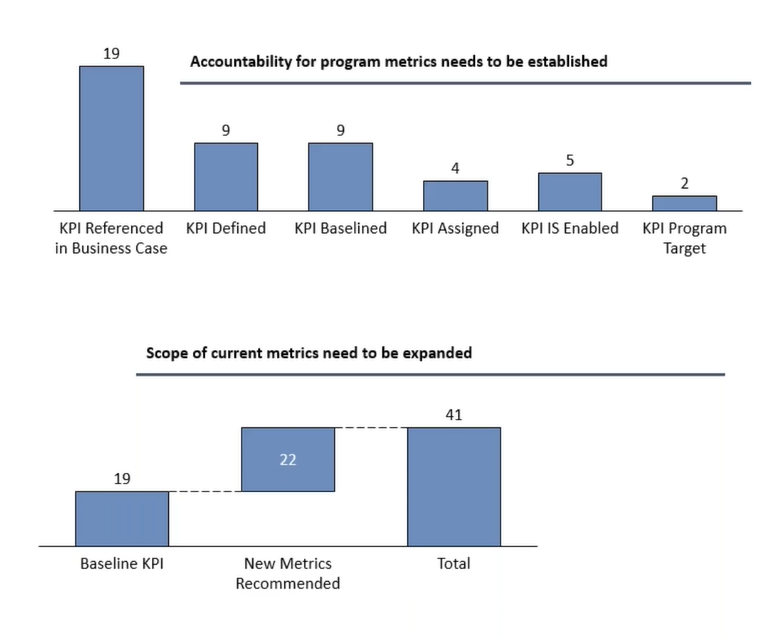
Most organizations lack a formal method of tracking KPIs – leaving the digital transformation program unattended. The first thing you can do to take a calculative approach in this pursuit is – define the key performance indicators that matter most to your business. After this, have a crystal-clear definition of KPIs. For example, there can be several nuances when you track even simple metrics such as cost per lead. It will depend on the channel, such as Pay Per Click Ads, sales prospecting methods, customer referrals, or other marketing channels. Therefore, be clear in what you want to measure and how you want to measure. Then, strengthen your business case by establishing:
Once your KPIs are clearly defined, robust analytics tools become indispensable in tracking your progress and surfacing actionable insights. With the right analytics platform—think Google Analytics, Tableau, or Power BI—you can automatically collect, organize, and visualize data from a variety of sources without burdening teams with manual reporting.
You could also use LeadSquared’s SIERA— it simplifies creating and sharing custom business reports, so you spend less time generating data and more time driving results.
A well-implemented analytics system empowers you to:
Decide how often you’ll review performance—whether it’s daily progress dashboards for critical initiatives or monthly deep-dives for executive overviews. The aim: ensure that your measurement practices are agile enough to inform decisions, optimize tactics, and keep your digital transformation momentum alive.
By integrating advanced analytics into your transformation efforts, you’ll gain the clarity needed to iterate quickly, celebrate wins, and course-correct where necessary—all while minimizing manual errors and freeing up your team for higher-value initiatives.
Manual data collection and reporting on a daily or weekly basis increases the chances of the program failing. That is why you should have an automated reporting mechanism in place when you start digitizing your processes. You should also expand the metrics list influenced by the program design.
If you’re looking for a platform that helps execute high-velocity sales and excels at measurement, reach out to LeadSquared! Not only does the LeadSquared CRM provide you with tools to measure your growth but it also helps digitize existing processes.
Align KPIs by involving stakeholders early and linking metrics directly to strategic objectives. This ensures that digital efforts drive measurable business value.
These KPIs should be reviewed quarterly at minimum to adapt to evolving business needs and ensure progress is on track.
As organizations roll out new digital tools and platforms, it becomes crucial to track how effectively these technologies are actually being used. That’s where adoption and performance metrics step in—they paint a clear picture of real engagement, not just installs or sign-ups.
Here’s what you should be looking at:
Active Users: How many employees or customers use the tool daily or monthly? This shows whether your investment is becoming part of their routine.
Adoption Rate: Of your total potential users, what percentage are regularly engaging with your new system?
Average Usage Time: Are people just logging in, or are they meaningfully interacting with key features?
Retention: Are users sticking around, or do you see a drop-off after initial exposure?
Why does all this matter? Simply put, high adoption and consistent performance signal that your people are embracing the change—meaning your transformation initiatives are gaining traction. Conversely, lagging metrics may indicate resistance, gaps in training, or perhaps that the solution isn’t meeting user needs.
Yes, qualitative outcomes like employee engagement or customer feedback complement quantitative KPIs and provide deeper insight into transformation impact.
Let’s talk about how to gauge the extent to which your business operations are driven by AI. Much like tracking core operational or finance metrics, understanding your AI-enabled footprint provides clarity for your digital transformation roadmap.
Here’s a straightforward approach:
Catalog Processes and Systems: Start by listing all core business functions—sales, supply chain, HR, customer support, finance, and so on.
Identify AI Integration: For each function, assess whether processes are automated or enhanced by AI technologies (think machine learning forecasts in supply chain, chatbots in support, or AI-powered analytics in finance).
Calculate Proportion: Divide the number of AI-enabled processes by the total number of critical processes to get a percentage.
For example, if out of 20 major business processes, 6 are currently utilizing AI tools (like Workday for automated HR analytics), your AI enablement rate is 30%.
Remember, not every area benefits equally from AI, so focus on high-impact opportunities. Tracking this metric over time helps you see progress, spot gaps, and identify areas for potential transformation.