Does it concern you that your reps spend hours – or even days – manually creating reports? Well, reports are essential to every company, whether you are a B2B or a B2C enterprise. Good reports can help improve your business efficiency, spot gaps in your existing strategies and business processes, and forecast conversion rates. But when done manually, reporting becomes a painfully slow, tedious process that drains your team’s time.
The solution? Automate your reports.
Yup – it sounds obvious. But it’s surprising how many teams are stuck doing it the hard way. With the right sales reporting software, you can consolidate data from various sales activities, generate insights instantly, and free up your team to focus on what really matters – nurturing prospect relationships.
What is Sales Reporting Software?
The term ‘sales reporting software’ is fairly self-explanatory – it’s a tool or program that helps your team generate and manage sales reports. Whether you want to create your own custom reports, or use pre-built templates, sales reporting software lets you track conversions, manage marketing campaign performance, and bring together sales data from multiple sources for a comprehensive view of your sales process.
And if you are already using a CRM, or planning to buy one, then this reporting tool is generally built into them. So, you can analyze and act on your data without switching between multiple platforms.
Why is Sales Reporting Software Necessary?
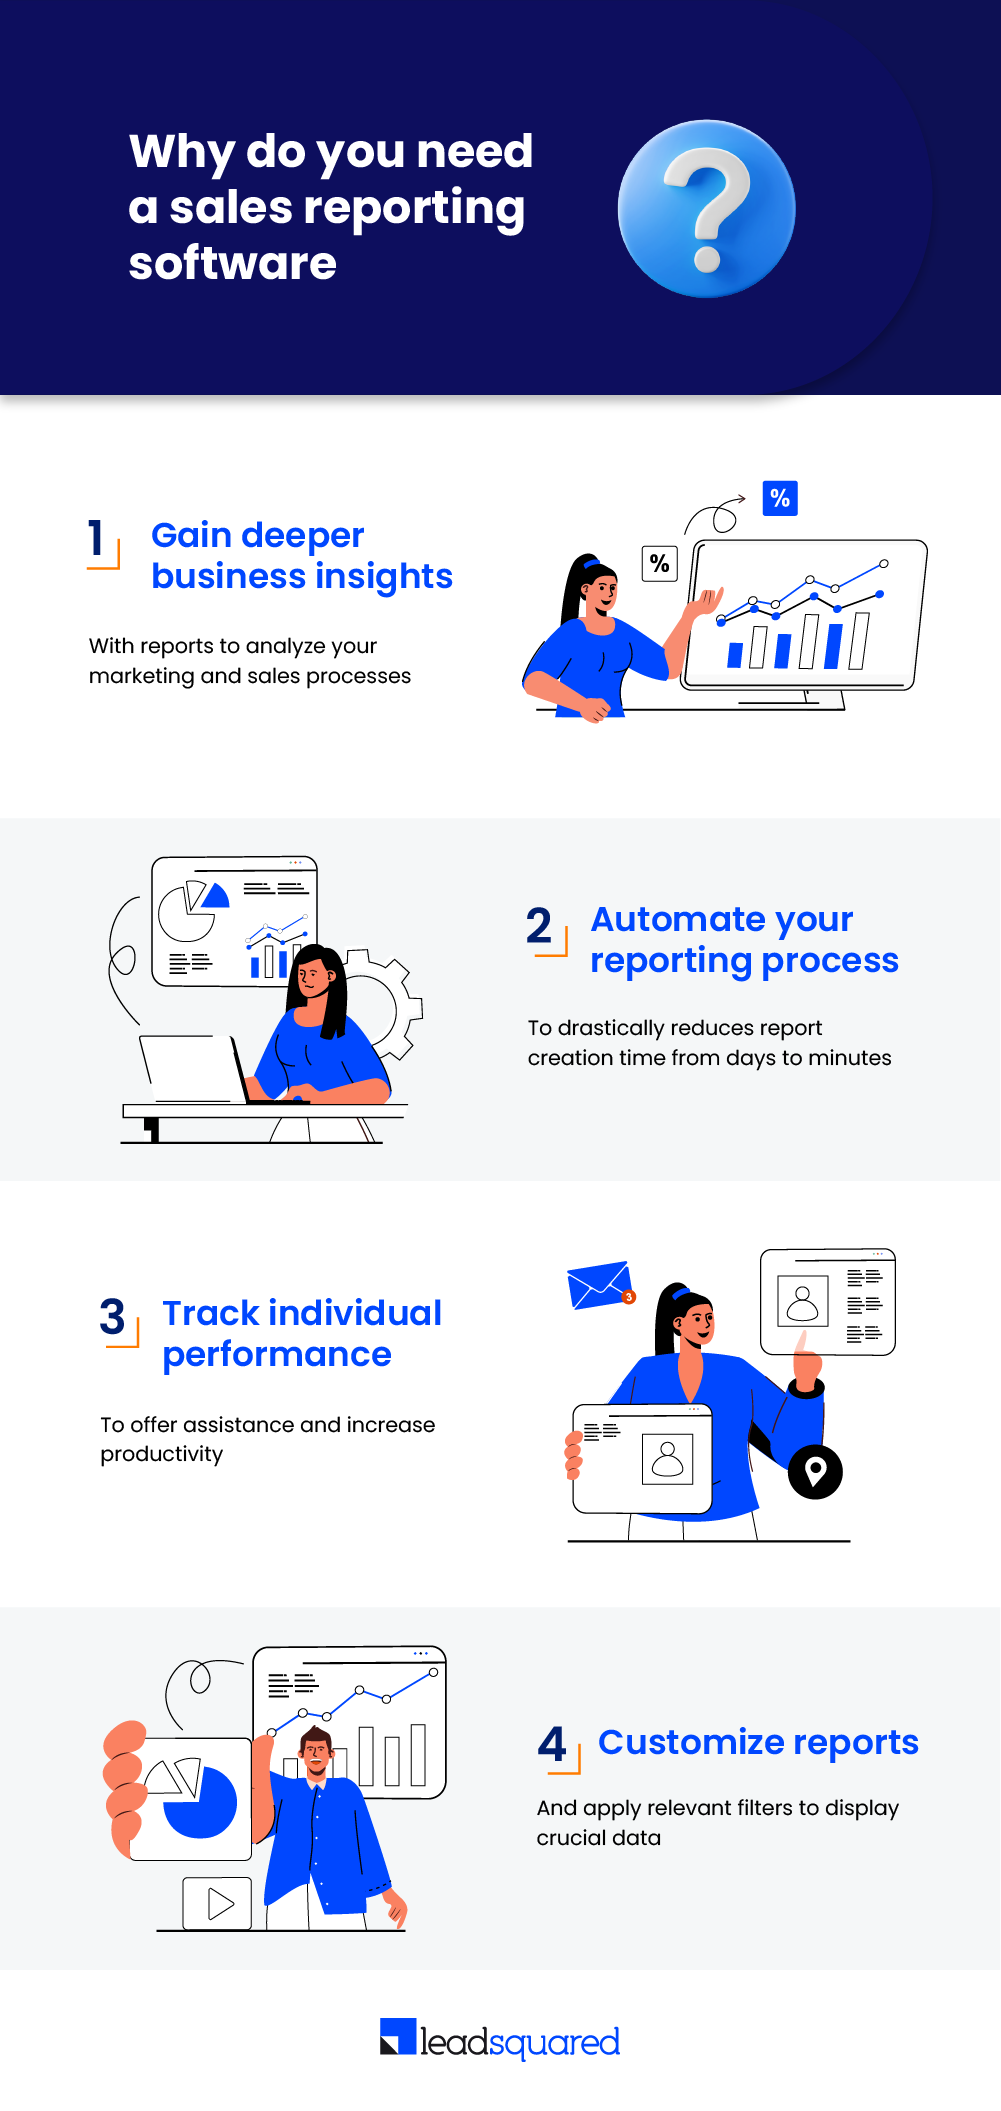
Here’s an infographic that shows you the four advantages of sales reporting software.
Sales managers can leverage these tools to track team performance and make informed decisions based on key performance indicators (KPIs).
Generally speaking, there are four types of reports generated by sales reporting software.
Types of Sales Reports and Metrics
1. Sales funnel reports – Sales funnel reports help you identify any hitches or bottlenecks in your sales funnel. It provides a detailed overview of which leads are at which stage in your funnel, where leads are dropping off, and more.
2. Sales performance reports – Sales performance reports help you identify your sales reps’ conversion rates, number of conversations, the value of deals closed, and other crucial sales metrics. This can help managers identify each salesperson’s strengths and weaknesses.
3. Forecast reports – These reports help predict where your business is headed by analyzing past data. With them you can estimate your expected conversion rate, total revenue from conversions, and even identify how many leads you’re likely to drop along the way.
4. Customer reports – Customer reports provide valuable insights into business strategies that are and aren’t working. Furthermore, they also help you understand your customer satisfaction levels, which rep is losing more clients and other important information like upselling and cross-selling opportunities.
Although there are many other sub-types of reports, like win-loss reports, sales cycle reports, etc., they can all be categorized under these main types.
Until now, we have dwelled on what sales reporting software is and how it can benefit businesses.
Next, we’ll look at the 10 best sales reporting tools—chosen based on the tools’ key features, pricing, and ratings from trusted platforms like G2, Gartner, and Capterra.
(Note: The ratings here are averaged from the above-mentioned review sites and are intended to give you a general sense of customer feedback.)
Top 10 Sales Reporting Software for 2025
Sales Reporting Software | Features | Average Rating on Gartner, Capterra, and G2 | Pricing |
LeadSquared | Ease of use, pricing, scalability, and no-code automation | 4.4 |
|
Pipedrive | Managing leads, creating pipelines, and nurturing campaigns | 4.3 |
|
Salesforce | Number of features, integrations, enterprise-focused | 4.6 |
|
HubSpot | Lead management, lead nurturing, workflow automation, and task reminders | 4.5 |
|
Zendesk Sell | Mobile CRM, simplicity, and artificial intelligence in CRM | 4.3 |
|
Zoho CRM | Number of features, price, integrability, ticketing services | 4.2 |
|
Bitrix24 | Managing tasks, telephony, building websites and analytics | 4.1 |
|
EngageBay | Email nurturing, marketing automation, sales pipeline management | 4.4 |
|
Power BI | Customer visualizations, mapping data, excellent mobile app | 4.5 |
|
MicroStrategy | Easy to use, AI analytics, zero click insights | 4.4 |
|
1. LeadSquared
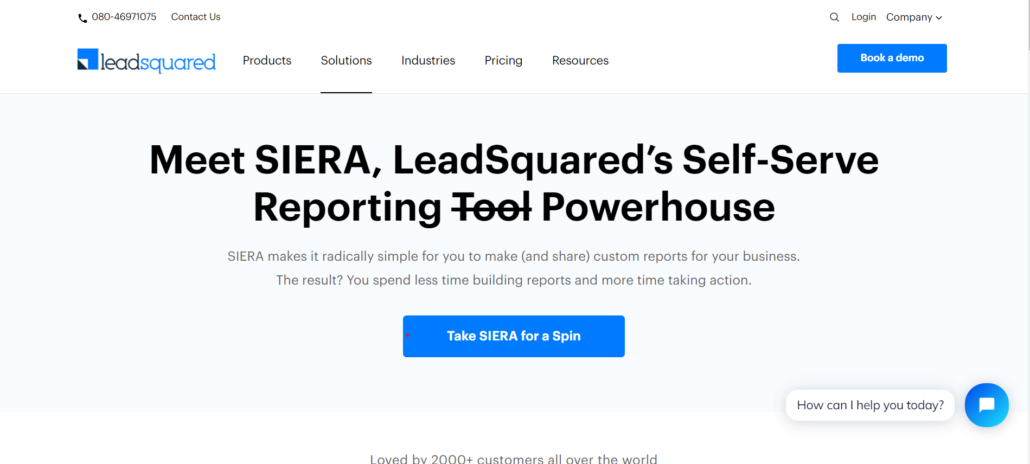
LeadSquared’s sales execution CRM is an end-to-end solution for businesses that want extensive sales features with great integrations and affordable pricing. The CRM is scalable and perfect for companies that wish for excellent reporting. LeadSquared offers one of the most comprehensive sales reporting solutions, providing advanced features and seamless integration capabilities. Some other features that the CRM is notable for are:
- Workflow automation
- Lead Tracking
- Lead Management
- Lead Scoring
Why choose LeadSquared?
SIERA (Sales Intelligence and Efficiency through Reports and Analytics) is LeadSquared’s next-generation self-service reporting tool. It allows users to build customized reports, analyze large volumes of data, create pivot tables, and more—all without relying on technical support.
In many CRMs, even a small change in reporting parameters means creating an entirely new report. With SIERA, you can easily adjust filters and metrics without starting from scratch.
Another key difference: most CRMs restrict report creation to admins. In LeadSquared, any user can build their own reports, making insights more accessible across the team.
Then where does LeadSquared fall short?
Since SIERA is relatively new (there is an in-built sales reporting platform as well with out-of-the-box reports), most of the feedback so far comes from a smaller group of early users—but the response has been mostly positive.
But some users have also mentioned occasional syncing delays when producing reports that may disrupt real-time updates.
Given the company’s strong track record for customer support and product reliability, there’s good reason to expect the tool to continue performing well as adoption grows.
Price:
- Lite – $25 per user/month
- Pro – $50 per user/month
- Super – $100 per user/month
Mobile app – Available on Google Play Store and the iOS App Store
2. Pipedrive
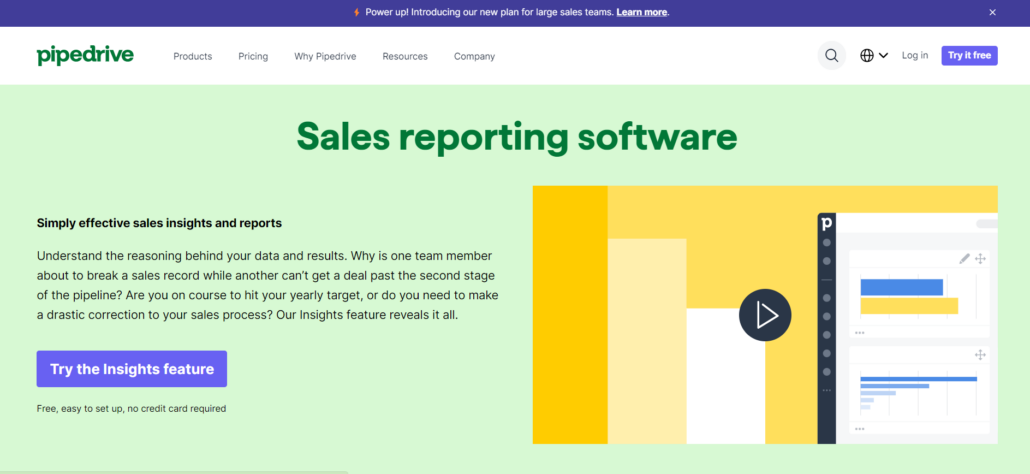
Pipedrive is a sales CRM best known for its strong pipeline management, lead distribution, tracking, and sales force automation features. It’s particularly well-suited for B2C businesses that need a reliable, insight-driven platform with interactive reporting.
Its tools help sales teams stay aligned and on track, offering visibility into key performance metrics and day-to-day field activities.
Why choose Pipedrive?
One unique feature native to Pipedrive is the interactable charts that make it easier for users to understand data trends.
Pipedrive also provides a custom report builder which allows users to create their own custom reports.
Then where does Pipedrive fall short?
Pipedrive’s custom report builder is a strong feature, but there’s a limit to how many reports you can create depending on your subscription tier.
Also, some users find the reporting interface a bit complex, especially when trying to build more advanced or tailored reports.
Price:
- Essential – $9.90 per user/month
- Advanced – $19.90 per user/month
- Professional – $39.90 per user/month
- Enterprise – $59.90 per month
Free trial availability – Yes, 14 days free trial.
Mobile app – Available on Google Play Store and the iOS App Store
3. Salesforce
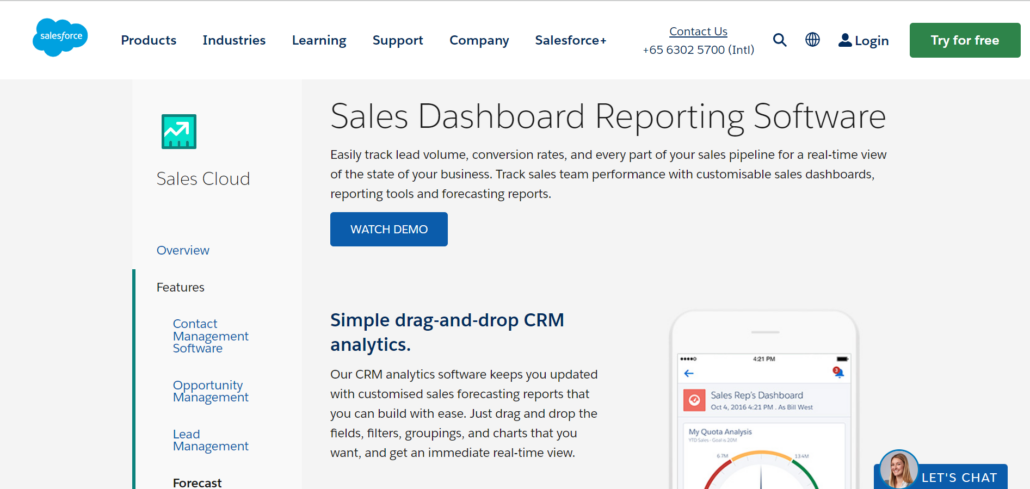
Salesforce is an enterprise-grade CRM known for its wide range of customizable features. As one of the longest-standing players in the market, it offers strong capabilities in sales forecasting, lead management, and overall sales operations.
Why choose Salesforce?
Salesforce’s reporting tool, Tableau, stands out for its highly customizable reporting capabilities. It’s one of the most flexible options available and offers robust solutions for complex reporting needs.
It can also integrate with other CRMs, making it a versatile choice for businesses with varied tech stacks. Here’s a look at a positive review from a user:
“The software is incredibly user-friendly, and its data visualization capabilities are second to none. I appreciate Tableau’s flexibility, allowing me to quickly and easily create custom visualizations and dashboards to help me better understand my data.”
Then, where does Salesforce fall short?
One common drawback of Salesforce’s Tableau is its cost—it can quickly become expensive, especially for smaller teams. It also has a steep learning curve, which can make it challenging for first-time users.
Another limitation is the time it takes to customize existing reports. Making adjustments isn’t always quick or intuitive, which can slow teams down.
Price:
- Einstein Predictions: $75 per user/month
- CRM Analytics Growth: $125 per user/month
- Advanced Analytics Platform with AI Built In – $150 per user/month
- Revenue Intelligence – $200 per user/month
Free trial availability – Yes, free for 14 days
Mobile app – Available on Google Play Store and the iOS App Store
4. HubSpot
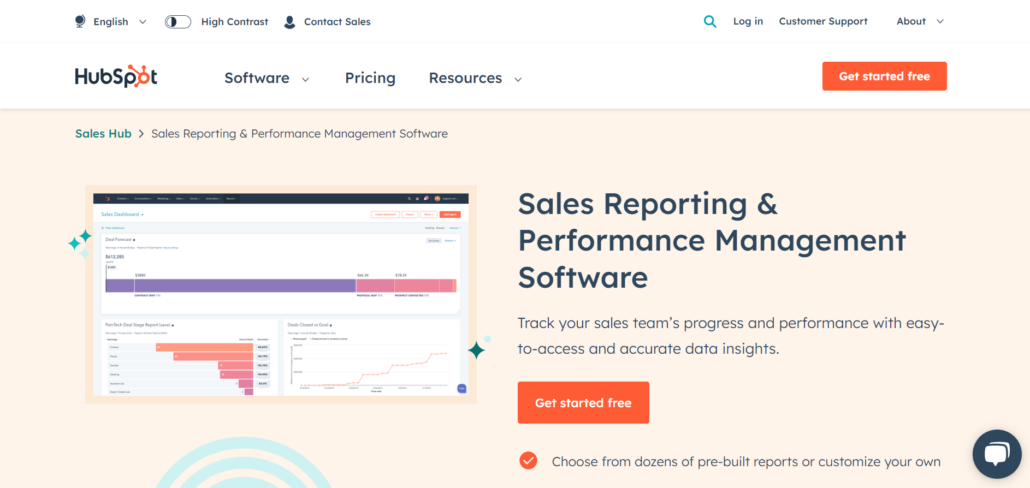
HubSpot is a widely known CRM, especially recognized for its strong marketing capabilities. That said, its Sales Hub stands out for being user-friendly and easy to adopt. A notable feature is its API developer tools, which let teams build custom integrations with ease. HubSpot is particularly effective when it comes to:
- Lead Capturing
- Lead Generation
- Sales Management
- Email Automation
Why choose HubSpot?
HubSpot’s sales reporting software includes a customizable dashboard and robust attribution reporting tools.
It also supports financial tracking, offering detailed visibility into metrics like gross margin, net income, and cash flow—helpful for teams that want sales and finance insights in one place.
Then where does HubSpot fall short?
One drawback of HubSpot is that it doesn’t offer certain advanced reporting capabilities—like cross-functional or consolidated reports.
Some users have also noted that its reporting features feel limited when compared to what other CRMs in the same category provide.
Price:
- Free – $0 per month
- Starter – $45 per month
- Professional – $450 per month
- Enterprise – $1200 per month
Free trial availability – Yes, free for 14 days
Mobile app – Available on Google Play Store and the iOS App Store
5. Zendesk Sell
Zendesk Sell is a sales CRM that helps businesses manage leads, client interactions, and tasks. With easy-to-use features, the tool provides good sales automation, lead management, and sales force automation.
Why choose Zendesk Sell?
Several reviewers loved that they could customize reports for the sales team in just a few minutes.
In fact, one reason that a client switched over to Zendesk Sell was its amazing reporting.
Furthermore, this software can integrate with applications like Google Sheets, Microsoft Excel, and Power BI to provide more insights.
Then, where does Zendesk Sell fall short?
One area where Zendesk Sell lacks is the reports are fixed and cannot be changed. Moreover, the CRM lacks a lot of AI-powered insights and analytics.
Price:
- Team – $19 per user/month
- Growth – $ 49 per user/month
- Professional – $99 per user/month
Free trial availability – Yes, available for 14 days.
Mobile app – Available on Google Play Store and the iOS App Store
6. Zoho
Zoho is a suite of products that includes CRM, ticketing platforms, customer service software, and a task scheduler. Its CRM is built for small and medium-sized businesses that need help managing leads, distributing them to the right reps, and nurturing them through email campaigns.
Why choose Zoho?
Now while Zoho CRM’s reporting tool is just another humble, ordinary software, combined with its product Zoho Analytics, it becomes a powerful solution for companies wanting in-depth analytics.
The first advantage of Zoho Analytics is its real-time reporting. One reviewer commented,
“Giving executives real-time access to the numbers that matter means we make better decisions, respond faster to threats and opportunities, and grow our business quicker.”
Plus, it is very easy to view and interact with the reports with this sales reporting software.
Then where does Zoho fall?
Zoho’s products aren’t the most customizable, and this can be an issue, especially if you want to tailor the software to your business needs.
It is also difficult to send those reports automatically.
Users report that Zoho has high charges for additional team members, not to mention poor customer support, lack of unique features, and complex setup.
Price:
- Free – $0/month (For two users)
- Basic – $24/month
- Standard – $48/month
- Premium – $115/month
- Enterprise – $455/month
Free trial availability: Yes, available for 15 days
Mobile App – Available on Google Play Store and the iOS App Store
7. Bitrix24
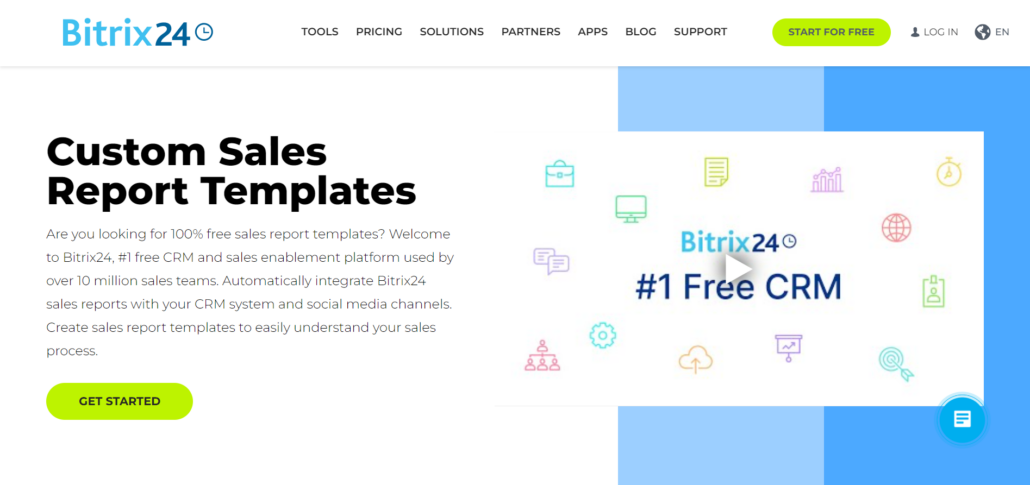
Bitrix24 CRM is part of a broader suite that includes tools for website building, project management, and more. It offers both on-premises and cloud-based options for businesses that want to manage tasks, track leads, and get solid marketing and sales analytics—all in one platform.
Why choose Bitrix24?
Bitrix24 offers a wide variety of sales reports which allows users to view them in real-time.
The tool is also relatively easy to use and offers intuitive reports.
Then, where does Bitrix24 fall short?
Bitrix24’s pricing might not be the most affordable for small businesses. Plus, the CRM is not very robust and frequently glitches out.
Furthermore, there have been numerous complaints about the CRM’s lack of customizable reports.
Price:
- Free – $0 per user/month
- Basic – $61 per 5 users/month
- Standard – $124 per 50 users/month
- Professional – $249 per 100 users/month
- Enterprise – $499 per 250 users/month
Free trial availability: Yes, available for 15 days
Mobile app – Available on Google Play Store and the iOS App Store
8. EngageBay
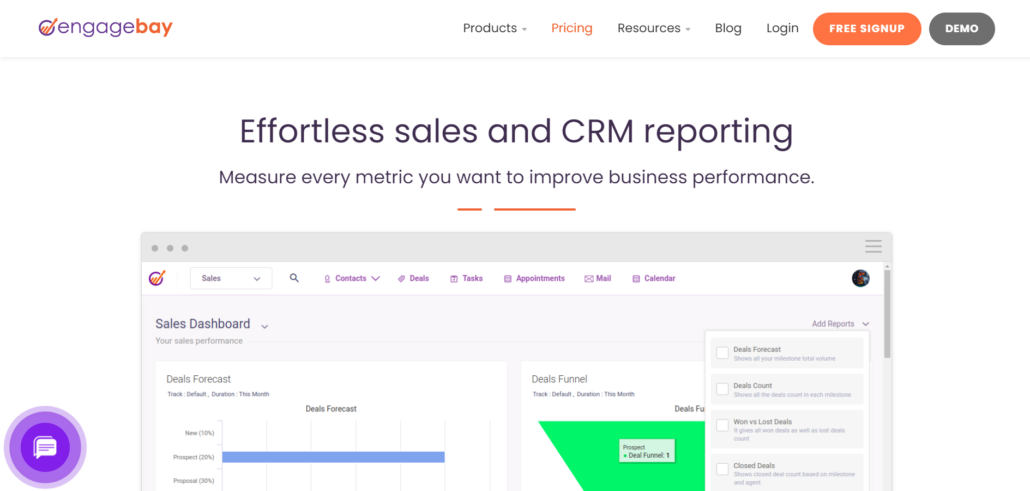
EngageBay is a CRM that offers businesses marketing, project management, and sales tools. This software saves time and improves efficiency by providing features like email marketing automation, contact management, segmentation, and sales force automation.
Why choose EngageBay?
EngageBay is a budget-friendly option, especially well-suited for small and mid-sized businesses. With a wide range of pre-built reports available, it helps businesses save time.
The reporting is also flexible, with customization and drill-down features that make it easier to uncover detailed insights when needed.
Then, where does EngageBay fall short?
The platform lacks customization options that match the branding of the business and has very limited reporting features.
Price:
- Free – $0 per user/month
- Basic – $12.74 per user/month
- Growth – $42.49 per user/month
- Pro – $84.99 per user/month
Free trial availability: No.
Mobile app – Available on Google Play Store and the iOS App Store
These are our top sales reporting tools available within CRM platforms. Beyond these, there are standalone analytics tools built specifically for reporting and data visualization.
The advantage of these general-purpose tools is their flexibility—they cater to a wide range of reporting needs and often offer more advanced visualization options.
That said, they can be harder to navigate, slower to set up, and often lack the team-specific insights that purpose-built CRM reporting tools provide.
One way to get the best of both worlds is by integrating your CRM with an external reporting tool. Here are some tools that can integrate with CRMs to provide deep insights.
9. Power BI
Power BI is Microsoft’s business intelligence platform, designed to help teams connect data from multiple third-party tools and visualize it in one place. It supports real-time data access, handles large data volumes with ease, and offers a customizable, interactive interface that’s built for exploration.
Why choose Power BI?
One of Power BI’s strongest suites is its data visualization. One customer provided a note on how:
“The visualization part and other chart types are very well designed, giving the user a clear and elementary understanding.”
Apart from this, Power BI supports stunning dashboards and interactive reports.
Where does Power BI fall short?
One issue with this software is that visualization is challenging, which means that you need another third-party application to create these.
Power BI is also less powerful than other data analysis tools, as it does not have a built-in programming language, so developers must use DAX or other third-party tools to manipulate data.
Price:
Pro – $10 per user/month
Premium – $20 per user/month or $4,995 per capacity/month
Free trial availability: Yes, available for 60 days.
Mobile app – Available on Google Play Store and the iOS App Store
10. MicroStrategy
MicroStrategy is a business intelligence platform that empowers businesses to build and deploy analytical applications. They provide users with reports, real-time dashboards, documents, mobile applications, and even HyperIntelligence, a technology that brings relevant insights with zero clicks.
Why choose MicroStrategy?
MicroStrategy offers excellent security to your reports. It also has a robust mobile application and is more affordable than Tableau and Power BI.
And no matter how complex the data is, you can easily create dashboards for it and export it quickly.
Then where does MicroStrategy fall short?
This software can be pretty daunting when you use it for the first time, as its interface isn’t very intuitive.
And as with any other feature-intensive software, there is a very steep learning curve with MicroStrategy.
Price:
No fixed pricing. You can contact info@microstrategy.com for more information.
Free trial availability: Yes, available for 90 days.
Mobile app – Available on Google Play Store and the iOS App Store
Concluding Remarks
Sales reporting software is crucial to all businesses that want to understand their processes and current standing in the market. However, along with sales reporting, you also need strong lead nurturing, automation, customer service, and sales automation features to help improve those business processes.
A full-fledged CRM like LeadSquared can help here. Not only does it offer excellent sales reporting tools, but it also provides end-to-end sales solutions to help businesses improve efficiency.
If you want to know more about what solutions we provide and how we help companies transform their businesses, get in touch with our CRM experts!
Our expert team will guide and assist you.
FAQs
What are the benefits of using cloud-based sales reporting software?
Cloud-based sales reporting software makes it easier for teams to access and work with data—especially when they’re in different locations. Instead of emailing files or keeping track of multiple spreadsheet versions, everyone sees the same real-time reports in one place.
It also helps with collaboration. Since the data is always up to date, teams can move faster, spot issues earlier, and make decisions based on a shared view of the numbers.
Sharing reports with clients or other departments is straightforward too. Most tools let you share dashboards without needing to export anything, and access controls help keep the data secure.
How does sales reporting software support sales management and training?
Sales reporting software gives managers a clear, up-to-date view of how the team is doing. You can see key metrics like win rates, deal size, and how quickly reps follow up with leads. This makes it easier to understand individual performance and provide feedback that’s based on real activity.
It also helps highlight where the sales process might be slowing down. If a certain stage in the funnel is consistently underperforming, you can dig into what’s happening there and decide if something needs to change.
For training, this kind of visibility makes a difference. You’re not working from general advice—you’re looking at specific patterns for each person. And because reports update automatically, you don’t need to chase down numbers or run manual checks to get a sense of progress.
Forecasting tools also come into play by helping managers see which deals solid and which ones are not deserving of too much attention.
Why is accurate sales forecasting important, and how does a sales reporting tool support it?
Accurate sales forecasting helps you plan ahead with fewer assumptions. It gives you a better sense of which deals are likely to close, how much revenue you can expect in a given period, and where there may be risks in your pipeline.
A sales reporting tool supports this by giving you access to current, organized data. Instead of working from scattered spreadsheets or estimates, you’re using real numbers—pulled directly from your CRM or sales activity. Some tools also include forecasting features that use historical patterns or lead behavior to help you project revenue more realistically.
This helps teams allocate their time and resources more effectively, identify potential gaps early, and make more informed decisions when it comes to budgets or growth targets.
How can reporting insights from a sales reporting tool improve your sales strategy?
Sales reports give you a clearer view of how your business is faring and of the things that pull the strings of its operations. By regularly reviewing performance metrics, you can see if your team is hitting its goals, or if there are patterns that suggest a change in strategy might be needed.
For example, if a report shows that leads are consistently dropping off at a specific stage in your funnel, it could be a sign to revisit your messaging or provide more support at that point. If customer data shows declining retention, it may be time to adjust your follow-up or engagement efforts.
Modern CRMs like LeadSquared, can help streamline this process by connecting reporting with automation.
How do dashboards help align sales reps and improve team performance?
Dashboards give sales teams a shared view of key metrics. Reps can see how they’re performing, and managers can monitor team progress easily.
You can also track things like lead volume, deal stages, and individual activity.
It also improves coaching. When performance data is easy to access, feedback becomes more focused. You can look at specific numbers—like win rates or follow-up times—and base conversations on that.
Dashboards also help keep teams on the same page by giving them shared access to relevant information.
How do individual rep dashboards support sales performance and feedback?
Individual dashboards give each sales representative a clear picture of how they’re performing, without having to wait for a formal review. They can check in on things like conversion rates, closed deals, or how far along they are toward their monthly targets whenever they wish.
That kind of visibility helps them catch patterns early. And if they’ve picked up speed somewhere, they can double down with confidence.
Managers benefit from this too. It’s easier to spot steady progress or sudden dips, and have more grounded conversations.
In the end, these dashboards make performance feel less abstract.
How does a sales reporting tool help improve team performance?
A sales reporting tool gives you a clear view of what’s happening across your sales team. You can track tasks, monitor communication with leads, and catch issues early.
It also helps managers understand how the team is performing, both at the group and individual level. These reporting tools usually come with custom dashboards and detailed reports that give you clean insights into how well your business is performing.
This makes it easier to adjust your strategy or test new ideas that may yield results.
Which sales KPIs should managers track beyond revenue using a sales reporting tool?
Revenue is useful, but on its own, it won’t tell you much about how your team is performing. To get a fuller picture, there are a few other metrics worth keeping an eye on with a sales reporting tool:
Deals closed: A basic but telling number. It shows how much is actually making it across the finish line over time.
Average deal size: This helps you understand whether your team is closing a lot of small wins or fewer high-value ones. It also plays a big role in forecasting.
Conversion rate: Looking at how leads move (or don’t) from stage to stage can show you where the process needs tightening.
Lead response time: Speed matters. The longer it takes to get back to a lead, the more likely you are to lose them. This one’s easy to overlook, but it can make a real difference.
Activity levels: Calls, emails, meetings—these don’t guarantee results, but they do show effort and pace. A sudden drop might signal burnout or something blocking progress.
Quota attainment: If most of the team is regularly missing quota, the issue may not be with individual reps—it could be with the targets or how leads are being distributed.
Pipeline velocity: This shows how quickly leads move through your funnel. If they’re dragging, it’s worth looking into whether certain stages are causing trouble.
Lead-to-customer rate: It’s not just about how many leads you’re bringing in. What matters is how many turn into real business.
With these KPIs, you get a comprehensive picture of what’s driving your outcomes.
What are the benefits of sharing interactive sales reports with stakeholders?
Stakeholders are people who have a vested interest in your sales outcomes. This includes executives, finance teams, marketing leads, or even external partners and investors. They’re not running sales day-to-day but rely on data to make decisions.
Sharing interactive reports helps in a few key ways:
Stakeholders can easily view real-time metrics to make decisions.
Interactive reports allow for more effective follow-ups.
When stakeholders can explore data themselves, they’re more likely to stay involved and support your goals.
How does sales reporting software help with accurate revenue forecasting?
Sales reporting software gives you a real-time view of your pipeline, helping you understand which deals are likely to close and when. With it you can base forecasts on actual deal stages and historical patterns.
It also helps you spot trends—like seasonal slowdowns or periods of growth—so you can plan for ups and downs ahead of time. You can break forecasts down by deal type (recurring vs. one-time), making it easier to budget, allocate resources, or set hiring plans.
And when you need to share numbers with finance or leadership, the data’s already clean and ready to go. In short, it turns scattered sales activity into a clearer picture of what’s coming, so your planning is more confident and less reactive.
