How to Write a Sales Report? [Types, Templates, and Metrics to Track]
Discover the art of creating sales reports, explore various types, find templates, get expert tips, and master essential tracking metrics.
Saleha Mariam
19 min read
SALES
How to Write a Sales Report? [Types, Templates, and Metrics to Track]
Contents
Imagine having a crystal ball for your business—one that reveals hidden opportunities, predicts trends, and empowers you to stay ahead of the competition.
While that doesn’t exist (yet!), a sales report is your next best option. Sales reports are your key to unveiling this magical foresight, transforming your business vision into reality.
These invaluable documents provide thorough insight into your sales processes to make informed decisions, set strategic goals, and ultimately, drive revenue growth.
In this blog, I will walk you through everything you need to know about creating and using sales reports effectively.
What is a Sales Report?
Sales reports are comprehensive documents that dissect sales data and can be used to transform raw numbers into actionable insights.
But what exactly are they, and why should you care?
A sales report acts as a compass to guide your sales team’s efforts. It’s a structured analysis of various aspects of your sales activities, designed to help you understand what’s working, what isn’t, and what needs to be improved. Think of it as a window into your sales performance!
Sales reports come in various types, tailored to address specific areas of interest. Sales managers or team leads can use these reports to derive distinct insights based on the challenge they wish to solve. Let’s dive into the different types of sales reports.
Types of Sales Reports
Sales reports can broadly be categorized as follows:
1. Based on time intervals:
Sales reports based on time intervals are used to measure team performance, evaluate the probability of meeting sales targets, identify top performers, and track daily, weekly, and monthly trends.
1. Daily Sales Report:
The daily sales report offers a comprehensive view of your daily sales activities, including the number of meetings scheduled, customer interactions, and product sales. It’s an essential tool for evaluating daily team performance, even on days when sales transactions may not occur.
Important metrics to track: Number of outbound calls, number of sales meetings held, number of new sales opportunities, sales volume, and product demos completed.
Used by: Sales teams, managers, team leads
Ideal to: Assess team productivity, maintain or increase transaction volume, and improve average deal size.
2. Weekly Sales Report:
A weekly sales report summarizes sales and revenue performance over a seven-day period, enabling you to spot trends and patterns, like weekly sales or revenue peaks.
Important metrics to track:Week-over-week sales growth rate, weekly lead to deal conversion, and marketing ROI for the week.
Used by: Sales teams, managers.
Ideal to:Achieve steady weekly revenue growth and transaction volume while improving the sales growth rate.
3. Monthly Sales Report:
A monthly sales report guides key strategic decisions on inventory, marketing, performance, product development, sales forecasting, and customer experiences.
When used by teams beyond sales, the report aids in budget planning and resource allocation based on sales performance insights.
Important metrics to track: Monthly MQL to SQL conversion, monthly lead to customer conversion, number of deals closed, and customer acquisition cost (CAC).
Used by: Sales teams, finance teams, marketing heads.
Ideal to:Increase monthly revenue, analyze sales trends, and optimize sales by product category.
4. Quarterly Sales Report:
Quarterly sales reports cover sales data for a quarter, typically three months, helping you identify long-term trends and adjust your strategy.
Important metrics to track: Quarterly competitive win rate, quarterly sales growth rate, churn rate, quarterly revenue, and customer retention rate.
Used by: Sales teams, Chief executives.
Ideal to:Achieve quarterly revenue growth, refine strategic selling approaches, improve sales growth rate, and set targets for the next quarter.
2. Based on sales dimensions
1. Sales by Channel Report:
The sales-by-channel report shows where your sales originate, whether from online channels, physical stores, or third-party partnerships. This insight helps you allocate resources effectively.
Important metrics to track: Channel conversion effectiveness, channel contribution margin, revenue by channel, and net promoter score (NPS).
Used by: Sales teams, marketing teams.
Ideal to:Increase revenue from high-performing channels, improve conversion rates for underperforming channels, and gain a larger market share for key channels.
2. Sales by Product Report:
The sales by product report helps you identify your best-performing products and adjust your sales strategy accordingly. It also allows you to identify opportunities to upsell and cross-sell products/services.
Important metrics to track: Product revenue share, cross sell and upsell effectiveness, number of product deals in the pipeline.
Used by:Sales teams, product teams.
Ideal to: Optimize revenue from top-performing products, maximize profit margins, and foster growth for select products.
3. Sales by Billing Location Report:
Billing location data shows regional sales trends, helping you identify sales surges or underperforming regions.
Important metrics to track: Customer concentration analysis, billing location revenue and market share.
Used by:Sales teams, regional managers.
Ideal to:Analyze regional sales performance, identify regions with positive sales trends, and target new regions for expansion.
3. Based on aspects of the sales process:
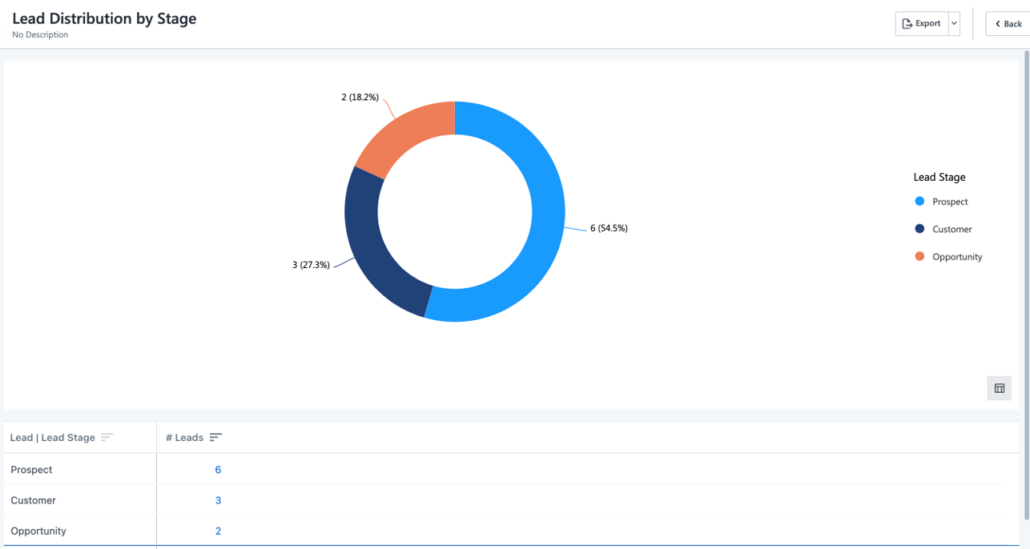
1. Sales Pipeline Report:
Your sales pipeline report is like a roadmap for your sales journey. It breaks down your sales process into stages, allowing you to track the movement of leads through the funnel. With this report, you can spot where potential deals might be getting stuck and optimize your approach accordingly.
Important metrics to track: Conversion rate by pipeline stage, average sales cycle length, pipeline value, sales pipeline velocity, pipeline coverage.
Used by: Sales teams, managers.
Ideal to:Improve lead to deal conversion rates, reduce sales cycle length for efficiency, and maintain a healthy pipeline value.
2. Conversion Rates Report:
Efficiency is the name of the game in sales, and the conversion rates report helps you keep score. By tracking conversion rates at each stage of your sales process, you can identify areas where leads are dropping off or converting exceptionally well. This insight is invaluable for refining your sales strategy.
Important metrics to track: Acquisition rate, opportunity to deal rate, close-win rate.
Used by: Sales teams, chief executives, marketing teams.
Ideal to:Increase lead to deal conversions, enhance MQL to SQL conversion rates, and improve opportunity to closed-won deal conversions.
3. Average Deal Size Report:
Understanding the size of your deals is crucial for revenue planning and product development. The average deal size report not only reveals trends but also helps you make data-driven decisions regarding pricing and product enhancements.
Important metrics to track:Average deal size, deal size growth rate, average transaction value.
Used by: Sales, finance, and product teams.
Ideal to:Monitor and optimize the size of individual sales transactions to maximize overall revenue and profitability.
4. Intermediate Sales Cycle Length Report:
If your sales cycle seems never-ending, the intermediate sales cycle length report is your solution. It provides a detailed breakdown of the time spent at each stage of your sales process, helping you pinpoint bottlenecks and streamline your workflow.
Important metrics to track: Length of sales cycle, average time to progress, pipeline velocity improvement and bottleneck reduction rate.
Used by:Sales and operations teams.
Ideal to:Reduce the time spent at intermediate sales stages, identify and resolve bottlenecks, and optimize stage-to-stage transition times.
5. Marketing Collateral Usage Report:
Your marketing collateral is only as good as its impact. The marketing collateral usage report helps you gauge how your sales enablement resources are performing in the field, allowing you to fine-tune your content for better results.
Important metrics to track: Collateral usage rate, conversion uplift from collateral, engagement rate, ROI, and feedback integration rate.
Used by: Marketing teams.
Ideal to:Increase collateral utilization and measure its impact on conversions.
6. Target vs. Achievement Analysis Report:
Are you hitting your sales targets? The target vs. achievement analysis report provides a clear answer. It ensures everyone in your organization is on the same page when it comes to goals and achievements, fostering alignment and accountability.
Important metrics to track: Sales targets vs. actual achievements, sales goal variance and sales achievement by sales representative.
Used by: Chief executives, managers, and sales teams.
Ideal to:Ensure sales teams meet or exceed sales quotas, analyze the performance of individual sales representatives, and minimize variance from sales goals.
7. Churned Customers Report:
Customer retention is often more cost-effective than acquisition. The churned customers report helps you identify why customers are leaving, allowing you to implement strategies to reduce churn and keep your customer base strong.
Important metrics to track: Customer churn rate, revenue churn rate, net promoter score (NPS), customer reactivation rate and customer lifetime value (CLV) impact.
Used by: Customer support and sales teams.
Ideal to:Increase the customer reactivation rate, develop effective recovery strategies to decrease customer churn, and assess the positive impact on customer lifetime value.
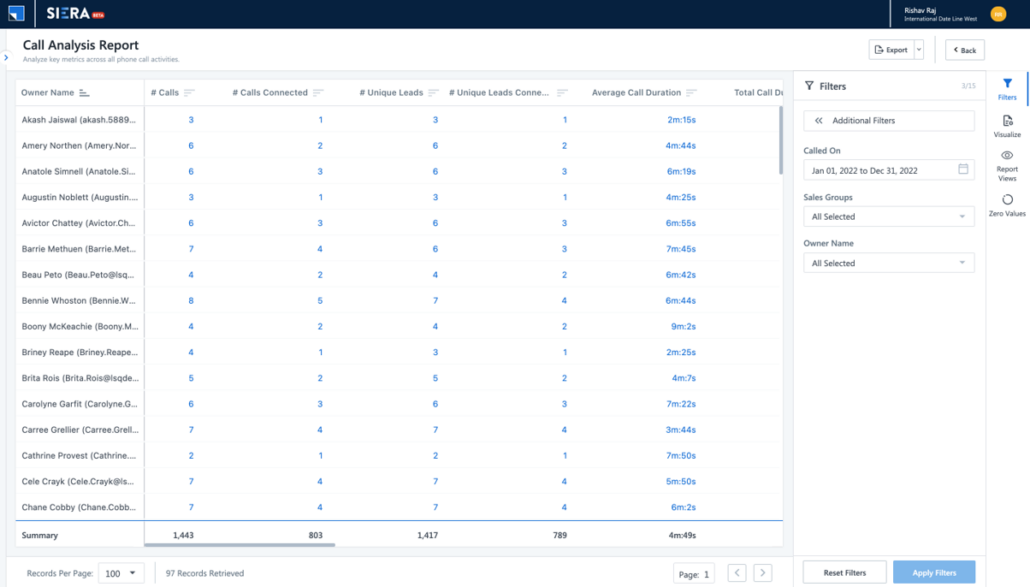
8. Sales Call Report:
In the world of sales, communication is key. The sales call report tracks the number of calls made and their outcomes. It helps sales reps and managers monitor performance, identify training needs, and improve customer interactions.
Important metrics to track: Call-to-opportunity conversion rate, number of calls made, average call duration, total talk time, and number of drop-offs.
Used by: Sales reps and managers.
Ideal to:Perform quality audits of call recordings, provide relevant training to improve performance and boost overall effectiveness of calls.
9. Revenue Report:
Last but not least, the revenue report is the financial pulse of your sales efforts. It gives you an overview of your total revenue and breaks it down by sources, providing valuable insights for financial planning and strategy.
Important metrics to track: Revenue growth rate, market share expansion, profit margin optimization, revenue by sales channel and revenue by product.
Used by: Finance and sales teams.
Ideal to:Track and assess the organization’s financial performance, with the aim of meeting or exceeding revenue targets and achieving sustainable growth.
Now that you have a clear understanding of the various types of sales reports at your disposal, it’s time to delve deeper into the importance of creating these reports in your business operations.
Why Do You Need Sales Reports?
Sales reports are not just numbers on a page; they are your guiding light in the world of sales. Here are some compelling reasons why you should invest time and effort into creating them:
Informed Decision-Making: Sales reports provide the data you need to make informed decisions. When you know what’s working and what isn’t, you can steer your sales efforts in the right direction.
Goal Alignment: Sales reports align your team with common goals. When everyone understands the targets and achievements, they work together more effectively.
Optimized Processes: By identifying bottlenecks and areas for improvement, sales reports allow you to optimize your sales processes for maximum efficiency.
Revenue Growth: Ultimately, sales reports are the path to revenue growth. They reveal opportunities to increase sales, improve customer retention, and drive your business forward., and drive your business forward.
Now that you’re convinced of the importance of sales reports, let’s explore how to create a sales report.
How to write Sales reports?
Creating a sales report isn’t just about throwing numbers onto a page. It’s about crafting a narrative that tells the story of your sales. When you’re writing a sales report, it’s crucial to keep it useful, engaging, and precise.
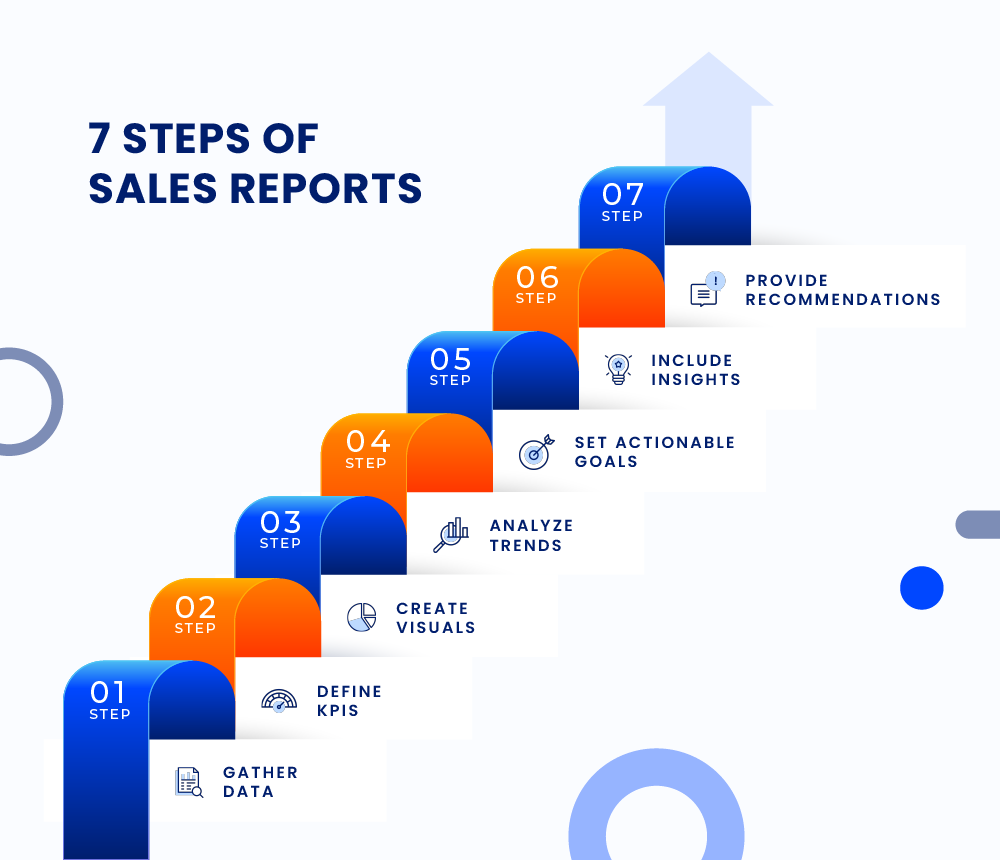
Here’s a step-by-step breakdown of how to create an effective sales report:
Gather Data: Start by gathering relevant data.To gather accurate data for your sales reports, you need to implement data collection methods such as point-of-sale systems, online sales platforms, or CRM software. For example, if you’re tracking daily sales, your point-of-sale system will automatically collect data on each transaction, including product names, quantities, prices, and timestamps.
Define KPIs: Next, define your key performance indicators (KPIs). These are like compass points for your report, guiding you to the most important insights. Choose the sales KPIs that matter most to your business.
For instance, if your SaaS business is not meeting its growth goals, it’s essential to build a report for visibility into specific metrics like customer lifetime value (CLV), trial-to-paid conversion rate, or user engagement to pinpoint areas that require attention and optimization. .
Create Visuals: To make your report engaging and easy to understand, use visuals like charts and graphs. For example, create a line graph that illustrates how your revenue has changed over the past six months. Visuals help your audience quickly grasp the information and identify trends.
Analyze Trends: After creating visuals, analyze the trends you see in your data. For instance, you might notice that your conversion rate has been steadily decreasing. This is a valuable insight because it indicates a problem in your sales process.
Set Actionable Goals: Based on your analysis, set actionable goals. For example, if your conversion rate is dropping, you could set a goal to improve it by 10% in the next quarter. This provides a clear direction for your sales team.
Include Insights: In your report, include insights and explanations. Explain the significance of your findings and suggest actions. Let’s say your analysis revealed that the drop in the conversion rate is due to longer response times to customer inquiries. This insight highlights the issue and offers context.
Provide Recommendations: Offer suggestions for optimizing sales strategies and make recommendations for improvement. In our example, you might suggest implementing a CRM system to respond to inquiries more promptly, which could boost the conversion rate.
Now that we’ve explored the fundamental principles of writing a compelling sales report, it’s crucial to understand the key elements that should be included in such reports to ensure their effectiveness.
Key Elements of a Sales Report
Executive summary with strategic insights: The executive summary is more than a brief overview; it should include strategic insights and recommendations. For an informed audience, this section should encapsulate the report’s main findings and provide advanced insights into the strategic implications.
Sales performance metrics: Include a wide range of performance metrics tailored to the purpose the sales report serves and the audience’s understanding. These metrics can include quarterly revenue, growth rates, market share, customer acquisition costs, customer lifetime value, sales conversion rates, and competitive win rates.
Segmentation analysis: Dive deep into sales data by segmenting it based on various criteria, such as product, region, customer demographics, and sales channel. Provide advanced insights into the performance of each segment and its implications for strategy.
Sales forecasting and predictive analytics: Utilize advanced forecasting models and predictive analytics to offer highly accurate projections for future sales performance. Discuss the methods used, data sources, and the degree of confidence in the forecasts.
Competitive analysis: Go beyond surface-level competitor analysis. Provide a comprehensive assessment of key competitors, their strategies, market positioning, and strengths and weaknesses. Discuss how your company’s performance compares to industry leaders.
Customer insights: Incorporate advanced customer insights, including behavioral patterns, purchase history, sentiment analysis, and customer segmentation. Discuss strategies for retaining high-value customers and acquiring new ones.
Sales funnel and conversion analysis: Provide in-depth analysis of the sales funnel, detailing conversion rates at each stage and identifying potential bottlenecks. Discuss strategies for optimizing the funnel.
Market trends and external factors: Discuss market trends, economic conditions, regulatory changes, and external factors that impact sales performance. Analyze how these factors influence the business.
SWOT analysis: Conduct a sophisticated SWOT (Strengths, Weaknesses, Opportunities, Threats) analysis, considering both internal and external factors. Go beyond surface-level observations and provide a nuanced perspective.
Recommendations and actionable insights: Offer advanced recommendations and actionable insights based on the data and analysis presented. Highlight strategic initiatives to capitalize on strengths, address weaknesses, and seize opportunities.
Appendices: Include appendices with detailed data, charts, and additional analysis for the audience to reference, demonstrating the depth of your research and analysis.
By incorporating these elements, you can better analyze your sales data and make informed business decisions.
Now that you have an idea about creating sales reports, all you need are a few templates to get started.
Sales Report Templates
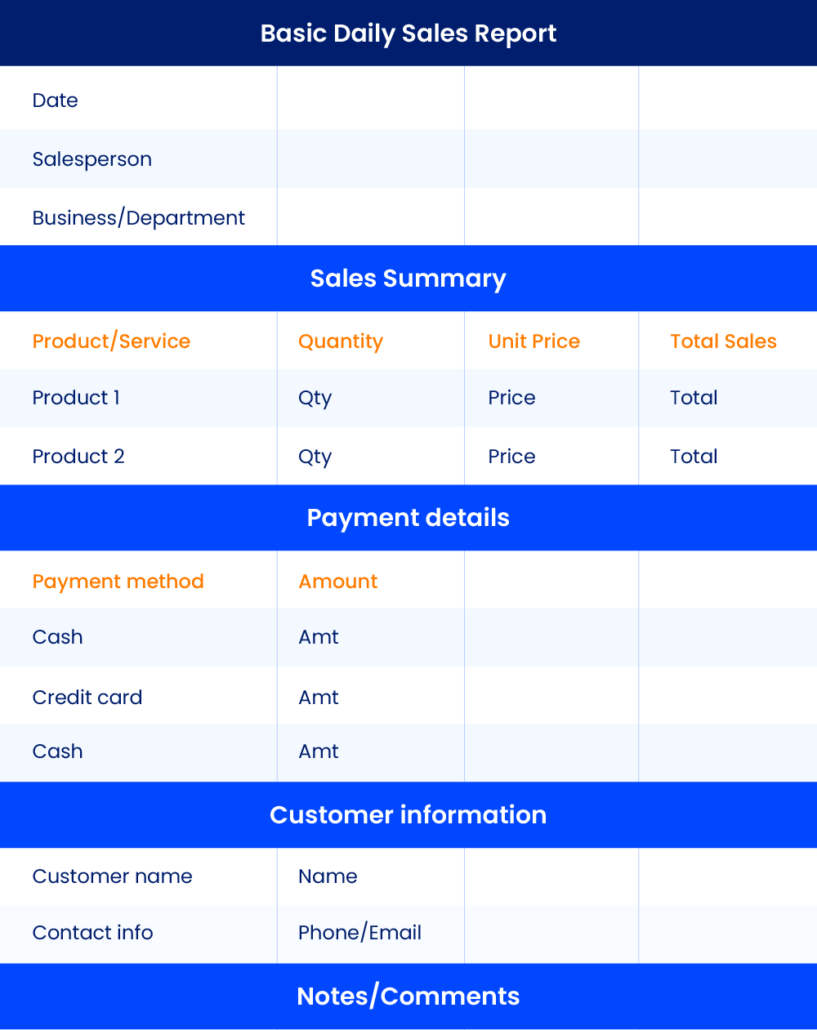
1. Basic Daily Sales Report Template for Excel:
Header Section: This template typically starts with a header section where you can input basic information such as the date, your name, and the name of your business or department.
Sales Summary: The core of the daily report includes a sales summary. This is where you list the products or services sold, the quantity, and the unit price. You can use formulae to automatically calculate the total sales for the day.
Payment Details: If your business deals with various payment methods like cash, credit card, or checks, there should be a section to record the details of these transactions.
Customer Information: You can also include a section to capture customer information, which can be useful to track loyal customers and their preferences.
Notes or Comments: It’s essential to provide a space for notes or comments, allowing you to highlight any significant observations, challenges, or opportunities encountered during the day.
Graphs and Charts: Some templates may include graphs or charts to visualize your daily sales trends. This helps identify patterns and make informed decisions.
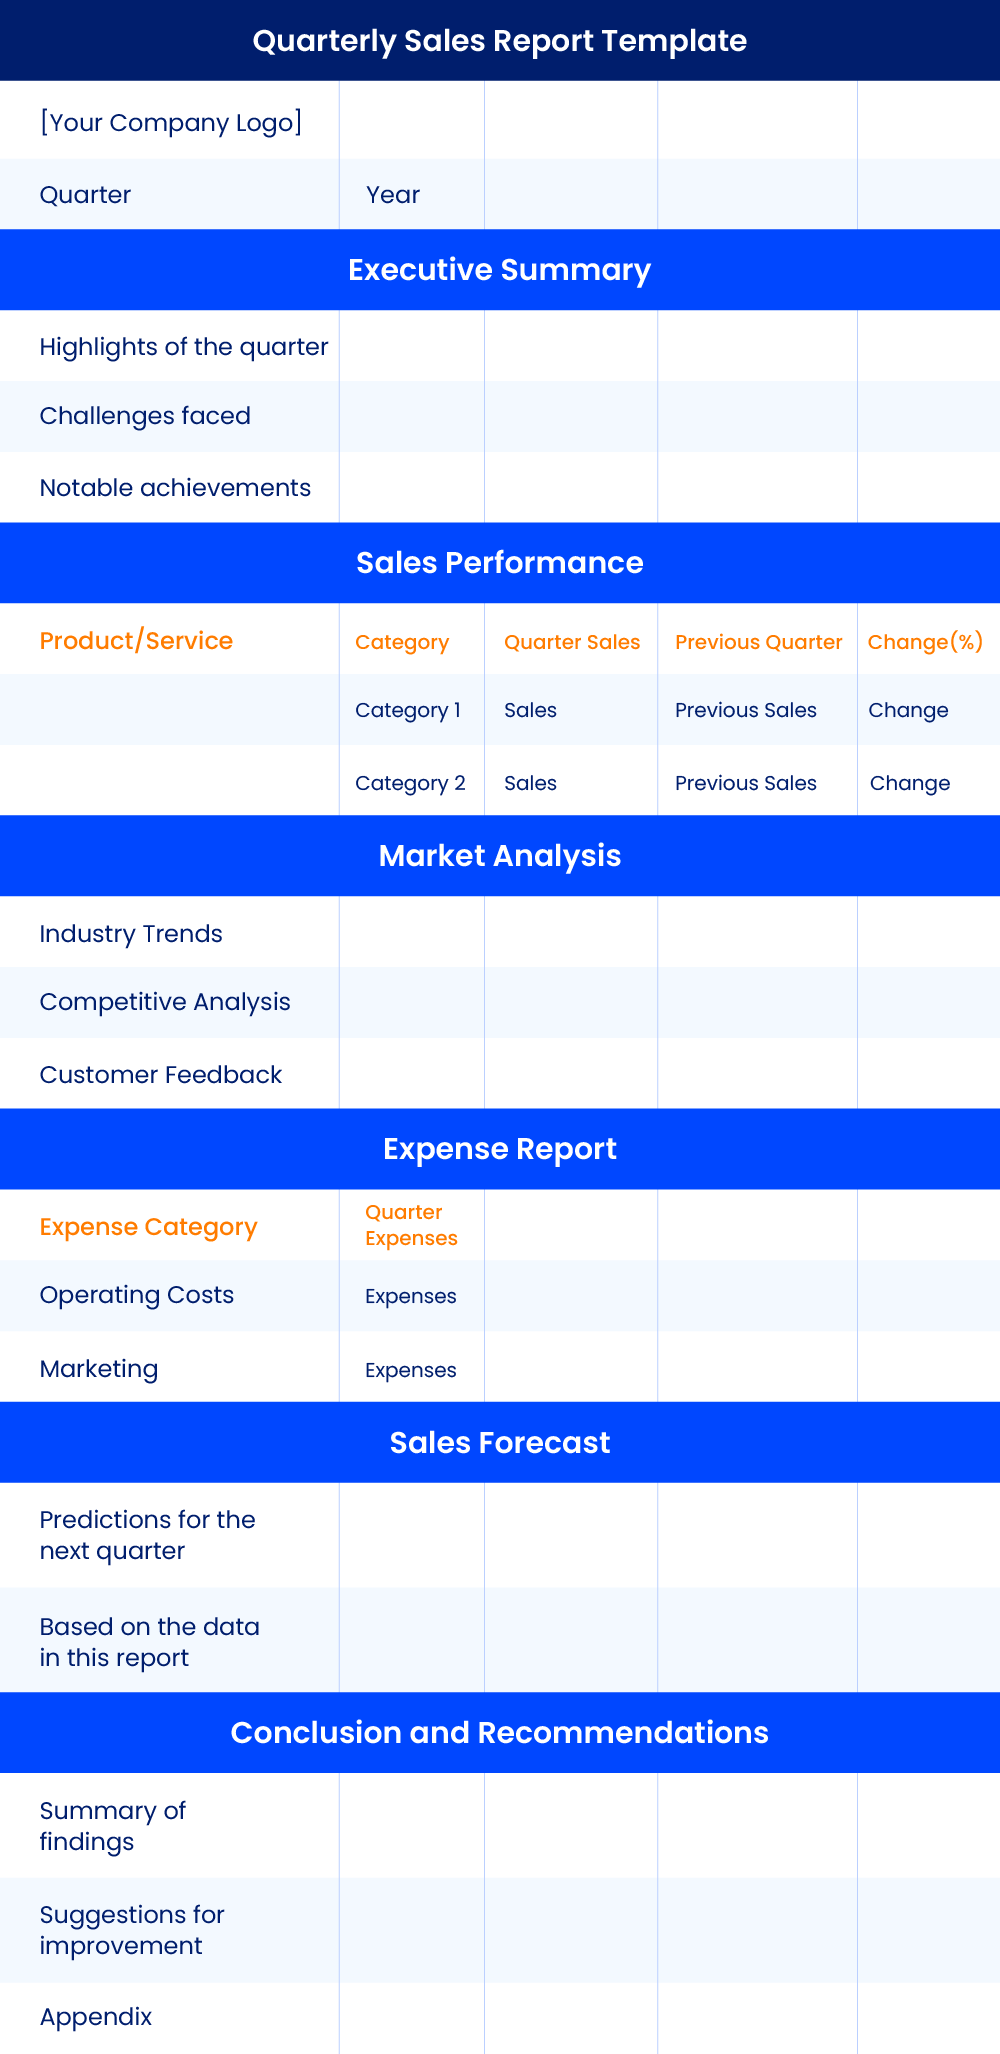
2. Quarterly Sales Report Template:
Cover Page: A quarterly sales report usually begins with a cover page featuring your company’s logo and report title.
Executive Summary: In this section, you summarize the key points of the quarter. Include highlights, challenges, and notable achievements.
Sales Performance: Break down the sales performance by product or service category. Utilize tables or charts to illustrate the quarterly sales figures, comparing them to previous quarters.
Market Analysis: Discuss the market conditions during the quarter. Mention any industry trends, competitive analysis, or customer feedback that impacted your sales.
Expense Report: Alongside sales data, include information on expenses incurred during the quarter. This can provide a comprehensive view of your financial health.
Sales Forecast: Offer insights into your sales projections for the upcoming quarter based on the trends and data presented in the report.
Conclusion and Recommendations: Summarize your findings and provide recommendations for improvements or strategies to capitalize on opportunities.
Appendix: If necessary, add an appendix for supplementary information like detailed financial statements, survey results, or any other relevant data.
Remember to customize these templates to suit your specific business needs, and regularly update them to monitor your sales performance effectively.
Now, lets delve into some practical ways to enhance your sales reporting.
Tips to Improve Sales Reporting
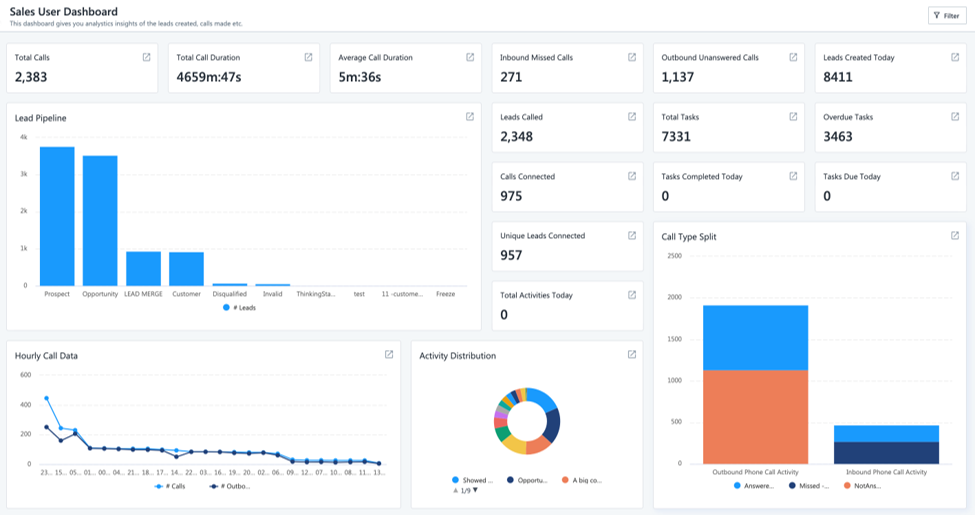
1. Automate with a CRMImplementing a Customer Relationship Management (CRM) system such as LeadSquared can help you automate data collection and reporting.
Sales Intelligence and Efficiency through Report and Analytics (SIERA) is LeadSquared’s new-gen self-service reporting tool.
With SIERA, you can track leads, opportunities, organization revenue, user performance, and more.
Want to optimize your sales reports? LeadSquared’s reporting powerhouse can help you:
Customize reports and apply relevant filters to display crucial data.
Make informed decisions using real-time analytics and actionable insights.
Design reports that trickle down your organization hierarchy to track user-level progress.
Improve business performance by analyzing large data volumes.
Sort and filter vast data volumes.
Create pivot tables.
Generate and save multiple reports for your teams.
2. Don’t present unverified or unorganized data: For example, if you’re presenting quarterly sales data, make sure the numbers are accurate and well-organized in your report. Don’t present conflicting or incomplete data.
3. Avoid data overload: Instead of presenting every data point, focus on key metrics. If your monthly sales report is cluttered with too much information, your audience may miss the most important insights.
4. Ensure clarity and consistency in formatting: Use a consistent format for headings, subheadings, and data presentation. Inconsistent formatting can make the report harder to read and understand.
5. Tailor to Your Audience: For example, if you’re presenting a sales report to your marketing team, focus on data related to marketing campaigns and lead generation.
6. Streamline Reporting: Avoid overwhelming your audience with excessive data. Highlight the most critical metrics, such as total revenue and conversion rates.
Conclusion:
They provide valuable insights into sales trends, customer behavior, and areas for improvement. LeadSquared’s robust analytics and reporting features help you make data-driven decisions and optimize your sales strategies.
To experience the power of LeadSquared’s reporting capabilities and witness how it can transform your sales efforts, get in touch with our team.
FAQs
1. How often do you need to make sales reports?
The frequency of your reports should align with your business goals. For example, if you’re a small e-commerce store, you may benefit from daily sales reports to closely monitor performance. However, a larger corporation might focus on monthly or quarterly reports for strategic planning.
2. How do I write a sales report?
Start by defining the purpose of the report, gather relevant data, use a standard template, and then customize it to suit your audience’s needs. For example, if your purpose is to evaluate the success of a recent marketing campaign, your report should primarily focus on the campaign’s impact on sales, conversion rates, and customer feedback.
3. What key metrics should I include in my sales reports?
The key metrics you should include in your sales reports depend on your business goals and objectives. However, some essential metrics to consider are: 1. Total Revenue: An overview of your sales performance. 2. Sales Volume: The number of products or services sold. 3. Conversion Rates: The effectiveness of your sales and marketing efforts. 4. Profit Margins: How much profit you make from each sale. 5. Customer Data: Demographics, buying behavior, and feedback for customer insights. 6. Weak & Strong Points: Highlighting areas of both success and concern.
4. What types of sales reports should every team track?
Sales teams usually track performance reports (revenue, win/loss rates), activity reports (calls, meetings), pipeline health reports (leads at each stage), and trend reports over time each giving different insights into performance and bottlenecks.
5. How often should sales reports be generated for actionable insights?
It depends on your goals — managers often use daily or weekly reports for performance monitoring and operational tweaks, while monthly/quarterly reports help with strategy and forecasting.
Table of Contents
Stay updated with the latest marketing & sales insights
Subscribe for updates
Enter your details and we'll send you a quick confirmation email to verify your address.
We’ll email you once a week. No spam-just valuable content


 A Quick Refresher Guide on TReDS