Higher Education Analytics
Monitor your admission and enrollment teams along with the student cycle

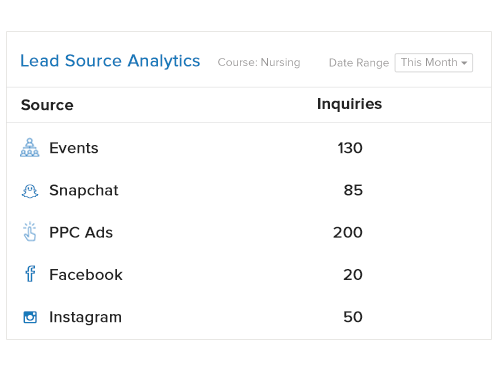
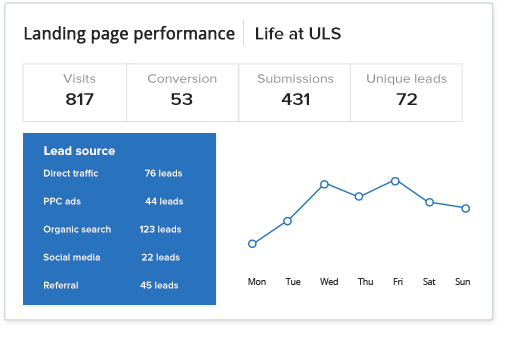
Lead source performance
Get clarity on the lead sources generating the best student inquiries and enrollments for your institute

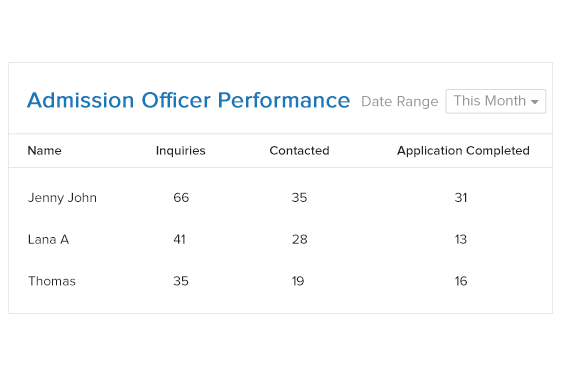
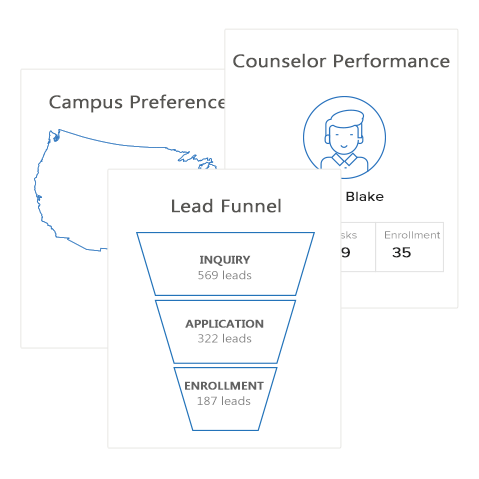
Admission officers’ performance
Measure the performance of your admission officers based on the number of enrollments they generate etc.

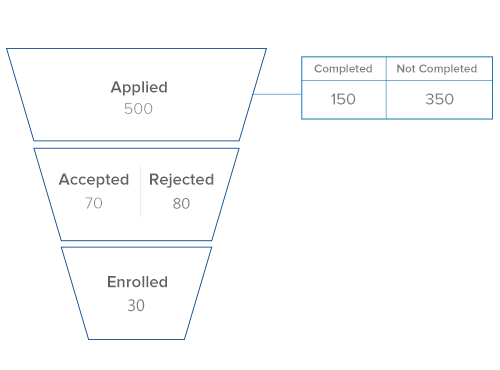
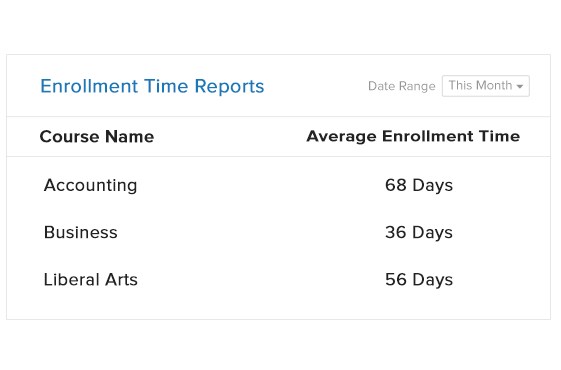
Application analytics
Get enrollment insights, including the number of leads in each stage, and the average time they stay there.

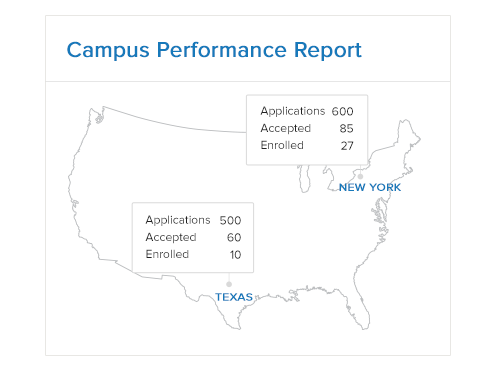
Campus performance reports
Measure how each of your campus locations is performing in terms of enrollments, and revenue.

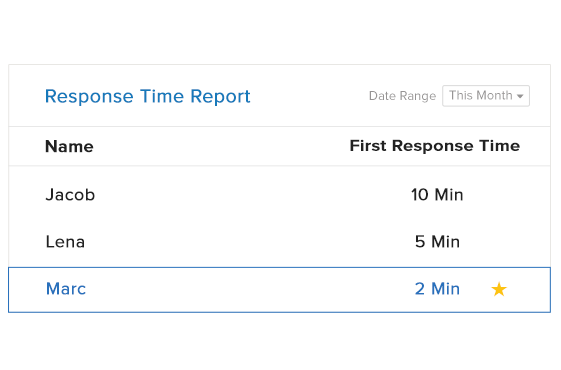
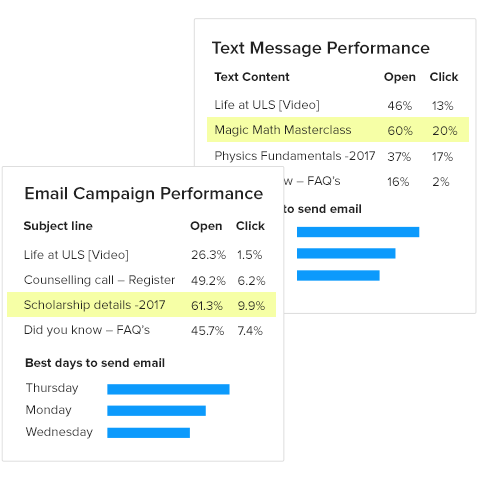
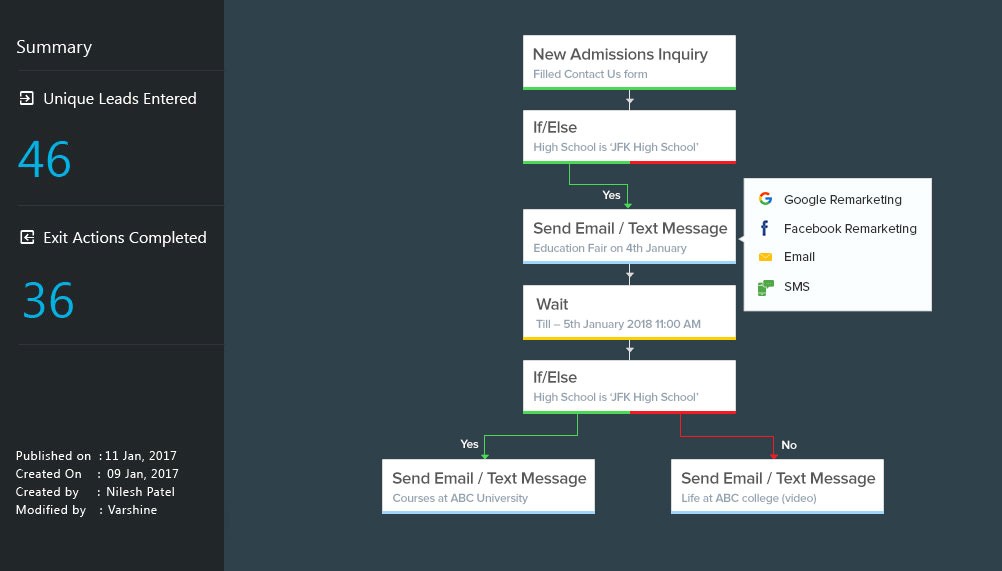
Communication insights
Know the performance of all your communication with prospective students, be it email, text or social.

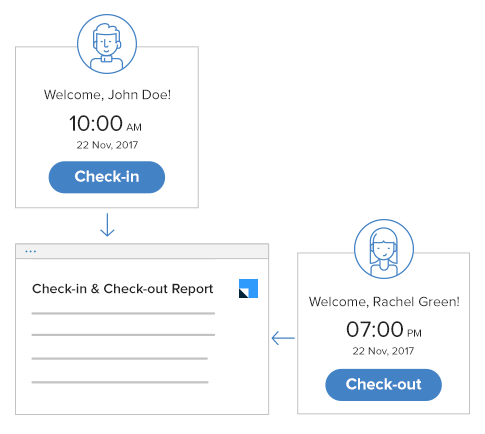
Check-in/check-out reports
Get a summary of your admission officers’ check-in and check-out times, logged hours, vacation days etc.
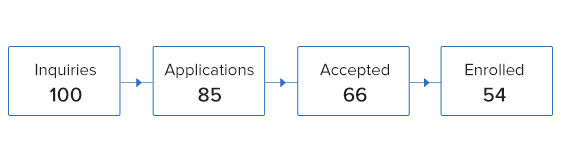
Enrollment funnel
Get reports on the different stages of the enrollment funnel the applicants are in at a given point in time.
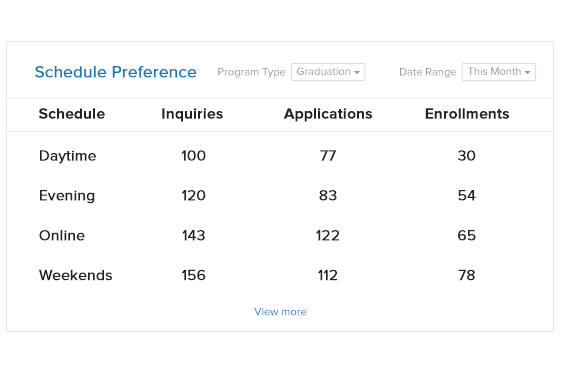
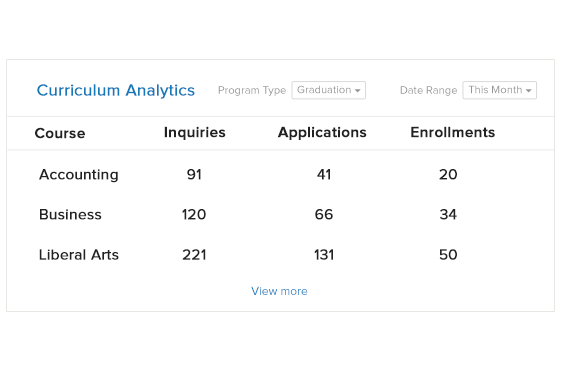
Curriculum preference analytics
Know the complete summary of the popularity of different programs, courses and schedules.

Enrollment analytics summary
Always know where you stand in terms of students enrolled against the approved enrollment targets.