


MARKETING
13 Customer Engagement Metrics to Improve your Marketing Strategy
Contents

A flourishing business? Check.
Innovative products/services? Check.
Happy and loyal customers? Well, how do you check that?
The answer is more straightforward than expected—customer engagement metric. Be it word-of-mouth advertising or improving brand image, an engaged customer always proves to be the best asset of a successful business.
According to a study, 78% of customers are willing to let go of a blunder if the customer service is polite and satisfactory. In such scenarios, where engagement is synonymous with loyalty, it becomes imperative for the sales team to transform their customer engagement strategies.
Customer Engagement Metrics are specific parameters that measure user engagement, which, in turn, helps formulate future marketing strategies. From assessing the number of visits to your website to the lifetime value of a customer, there are diverse metrics that can be used according to your business’ goals.
Let’s take an elementary example—a kid in your block opens up a lemonade stand. They keep a track of who comes to the stand and how often. Then, using this information they give out free coupons to customers with more than three visits. Pretty simple, right?
The kids understood that customer engagement is the essence of increasing revenue. It is the relationship between a business and its clients, where the business endeavours to establish, sustain and improve the interaction between the two. There are many more customer engagement metrics to tackle complex cases.
Often, the more your sales team chases after a customer, the more they try to get away. There are myriad factors that make or break the relationship between a business and its consumers. In many ways, customer engagement metrics help approach such scenarios strategically, preventing you from pulling a Hail Mary like spamming disinterested customers.
Customer engagement metrics give a broad view of which customers to focus on and how. If you have one customer who has put your emails in the spam folder and another inquiry about the availability of a specific product, you know you should focus on the latter.
Similarly, reviews in surveys, website visits, and other parameters help you understand how customers interact with your product. According to a Gallup study, engaged customers bring in 37% more revenue in retail banking than disinterested users.
You know your business is on the right track when it can boast of excellent customer engagement. Customer engagement metrics can help your business perform an accurate SWOT analysis to project growth and focus on your business targets. For example, if your blogs enjoy high viewership rates, your content must be strong. Or, in another scenario, a bad review in a survey can pinpoint the direction you need to work on to reach customer expectations.
After understanding your customers and the company’s areas of improvement, all that’s left is to formulate a fool-proof plan to provide value to your customers. It will ensure increased rates of loyalty and revenue. The planning phase of the marketing and selling process becomes easy to envision as the customer engagement metrics provide data that is not just qualitative but quantitative as well.
Let’s walk through the vital customer engagement metrics used widely, which will give your business a nudge toward success!
Net Promoter Score gives an idea of the likelihood of a customer recommending your products or services to their close circle. The thought and preferences of friends, family, or colleagues are the biggest motivators for buying something. This score is also great way to analyze how your service can publicize itself.
If you conduct a survey to ask whether people would suggest your business to others on a scale of 1 to 10, 10 being highly likely, then NPS is calculated as:

Where promoters rate your product 8-10, and detractors place it 0-7 out of 10.
You can use Google Forms, SurveyMonkey, or Ask Nicely to create surveys. Surveys are better than email campaigns for this metric, as customers can answer without investing much time and effort.
Have you ever used a product or service from a business for such a long time that it became an indelible part of your life? Imagine the revenue they must have generated through you during that period!
Customer Lifetime Value measures precisely that relying on how often and how much a customer spends on your product and how long they stick with you. It is essential to consider as getting new customers is generally a slow and expensive process.
Calculating CLV is done using the following formulae:


The only sure-shot way of achieving a higher customer lifetime value is to offer innovative products and provide excellent customer service!
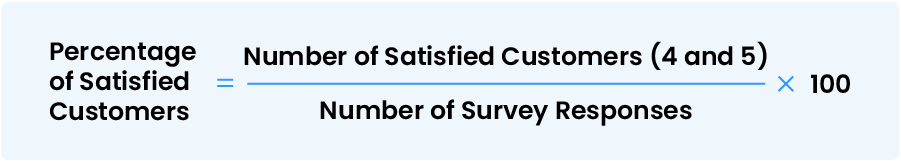
The customer satisfaction score indicates how satisfied the customer is with the product and service after the end of their experience. From a polite phone call to a survey requesting feedback—there are numerous ways to collect information about the customer’s overall satisfaction.
Doing so leaves a better impression on the customer’s mind as you assure them that their well-being is of prime importance. It also measures the likelihood of the customer returning to you when a need arises.
Suppose you ask customers to rate their experience on a scale of 1 to 5, where one is very unsatisfied, and five is very satisfied. Here’s how you can calculate the CSAT score:
Visit frequency is the number of times a customer comes back to your product or service. The patterns of your visit frequency are essential to understand how customers view your product and when they require your business. A food delivery app can check its visit frequency on a weekly basis, while an air conditioning store needs to check it on a seasonal basis.
Since visit frequency varies from business to business, you can get the most out of it by setting a target value for a fixed period.
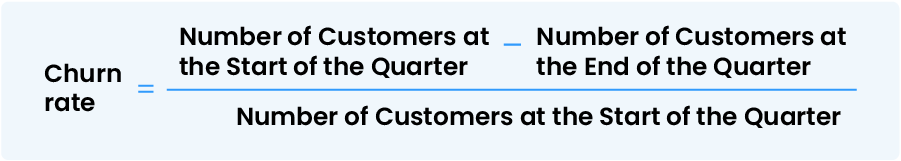
Customer Churn Rate refers to the number of customers that terminate their engagement with your business that had been financially rewarding for you. For example,
As you can infer, the lower the churn rate is, the better your business is doing. Although it is inevitable that some people will end their subscriptions, you don’t want the numbers to dip to the bottom. Hence, a higher churn rate, is a clear indication that a business needs to develop customer retention strategies.
If you have an app, there must be some features that your users adore, while some wait in a shadow to be of use someday. Feature usage implies the frequency with which customers use different features. This metric is essential to study as it draws our attention to features that can be improved for a better customer experience.
You can measure the feature usage using analytical tools like Google Analytics and LeadSquared.
Page Views measure the traffic observed by certain pages of your website. It counts the number of initial loads, reloads, and revisits by a customer. This metric is crucial in determining a user’s needs and planning how to engage them based on the observations. Google Analytics is efficient tools for dealing with page views.
First impressions are the last impressions. When it comes to your business, you must be wary of how the customer interacts with your product or services in the first week, as it can make or break future deals.
The first-week customer engagement metric concerns the rate at which the customer picks up or leaves your product. It is a clear indicator of the effectiveness of your onboarding process. You can always ensure satisfactory involvement by welcoming them warmly, asking for their feedback, or providing some offer as a greeting reward.
User Activity metric decides the number of unique users attracted to your product or services within a specified time interval. Accordingly, it has two parts: Daily active users (DAU) and Monthly active users (MAU). The varying patterns of user activity can help you decipher why the customers are opting for or against your business.
Isn’t it exhilarating to see your business getting recognized on social media platforms like LinkedIn, Twitter, or Instagram? The social engagement metric uses the number of views, likes, mentions, and shares to symbolize the product’s or service’s impact on people’s lives. It also opens avenues to strategize future marketing plans.
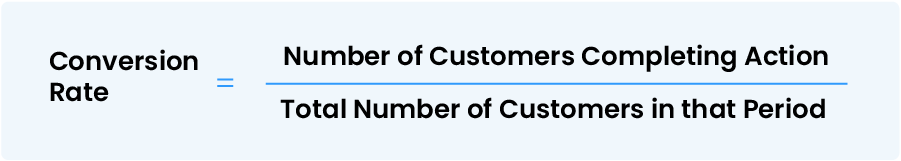
The mark of a genuinely interested customer is how willing they are to complete an action, like finishing a survey, ordering your product, or submitting a form.
Conversion Rate tells you the ratio of users who fulfilled a goal to all users who visited your website during a specific duration. It gives an idea of how well the business is doing and achieving customer expectations.
Another email–specific metric is the email open rate which measures the percentage of email recipients that have opened your email. Although every business’ email open rate varies according to their product or service, 17-28% is considered a good open rate according to a Mailmunch study. This metric is essentially incorporated to assess the success of email campaigns.
LeadSquared, a marketing automation platform, can help you track email clicks and opens, and it even has features to send bulk emails, A/B split test subject lines, and design interactive emails with its drag-and-drop editor.
List Growth Rate is a customer engagement metric specifically used for emails to determine how fast your mailing list grows. It provides a clear comparison between the number of new subscribers and unsubscribers within a specified period.

I hope this article helped you understand customer engagement and how you can benefit from the various metrics used to track it. The list is undoubtedly too long, but no need to get overwhelmed.
You can easily track all the customer engagement metrics on a single platform using LeadSquared. From insightful reports to visual graphs, your sales team will not have to run from pillar to post to discern the overall customer involvement in the products or services. Everything will be available on a single platform in the most intelligible form!
If you want to know more about how LeadSquared can help you tackle the metrics mayhem? You can get in touch with our team.
Enter your details and we'll send you a quick confirmation email to verify your address.


 Education Portal: A Must-Have for Online Admissions