


Today, customer service representatives face the challenge of delivering exceptional experiences across many channels. From traditional phone calls to emails, social media messages, live chats, and more, they must monitor and respond to activities across all these platforms.
However, managing this complex ecosystem and tracking activities or metrics from each channel can quickly become overwhelming, mainly when relying on manual processes or disparate tools. This is where a customer service dashboard comes in, helping you get detailed information about all your customer service operations.
In this blog, we will discuss customer service dashboards in detail, exploring the 10 impactful dashboard examples you can use for your customer service teams.
Let’s begin!
Customer service dashboards are powerful tools that transform raw data into actionable insights. They provide a real-time snapshot of your team’s performance, customer satisfaction levels, and overall operational efficiency.
With these insights at your fingertips, you can make data-driven decisions to optimize your customer service operations and gain benefits like:
Here are some examples of impactful dashboards that you can use for your internal team management and customer service operations:
Source
Customer support is not just the responsibility of one department. In most companies, it can include overall customer-facing teams such as product departments, sales teams, design teams, and others.
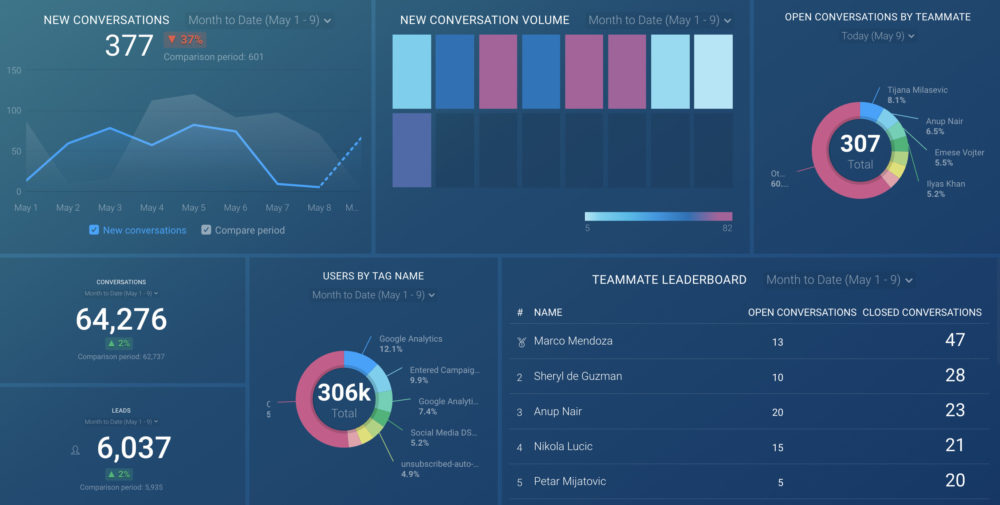
For such teams, a generic customer support dashboard can be crucial to help understand how well your teams are when it comes to addressing customer issues.
It helps you get all the essential support metrics in one place, improve support services, and understand how many outstanding conversations are there to help you manage these issues efficiently.
Target Users: Customer Service Teams, Sales Teams, Product or Design Teams
Essential KPIs:
Source
For most organizations, the CSAT or customer satisfaction score, is the most important KPI, as it tells you how happy your customers are with your services.
With a CSAT dashboard, you can gauge customer satisfaction metrics, including identifying areas where customer satisfaction might be declining and taking proactive steps to address them.
Target Users: Customer Service Teams, Product Managers
Essential KPIs:
Source
This dashboard provides a clear visual representation of how many customer inquiries you receive through different channels (phone, email, chat, social media, etc.). This helps you identify which channels are most popular and allocate resources accordingly.
Target Users: Customer Service Teams, Product Managers
Essential KPIs:

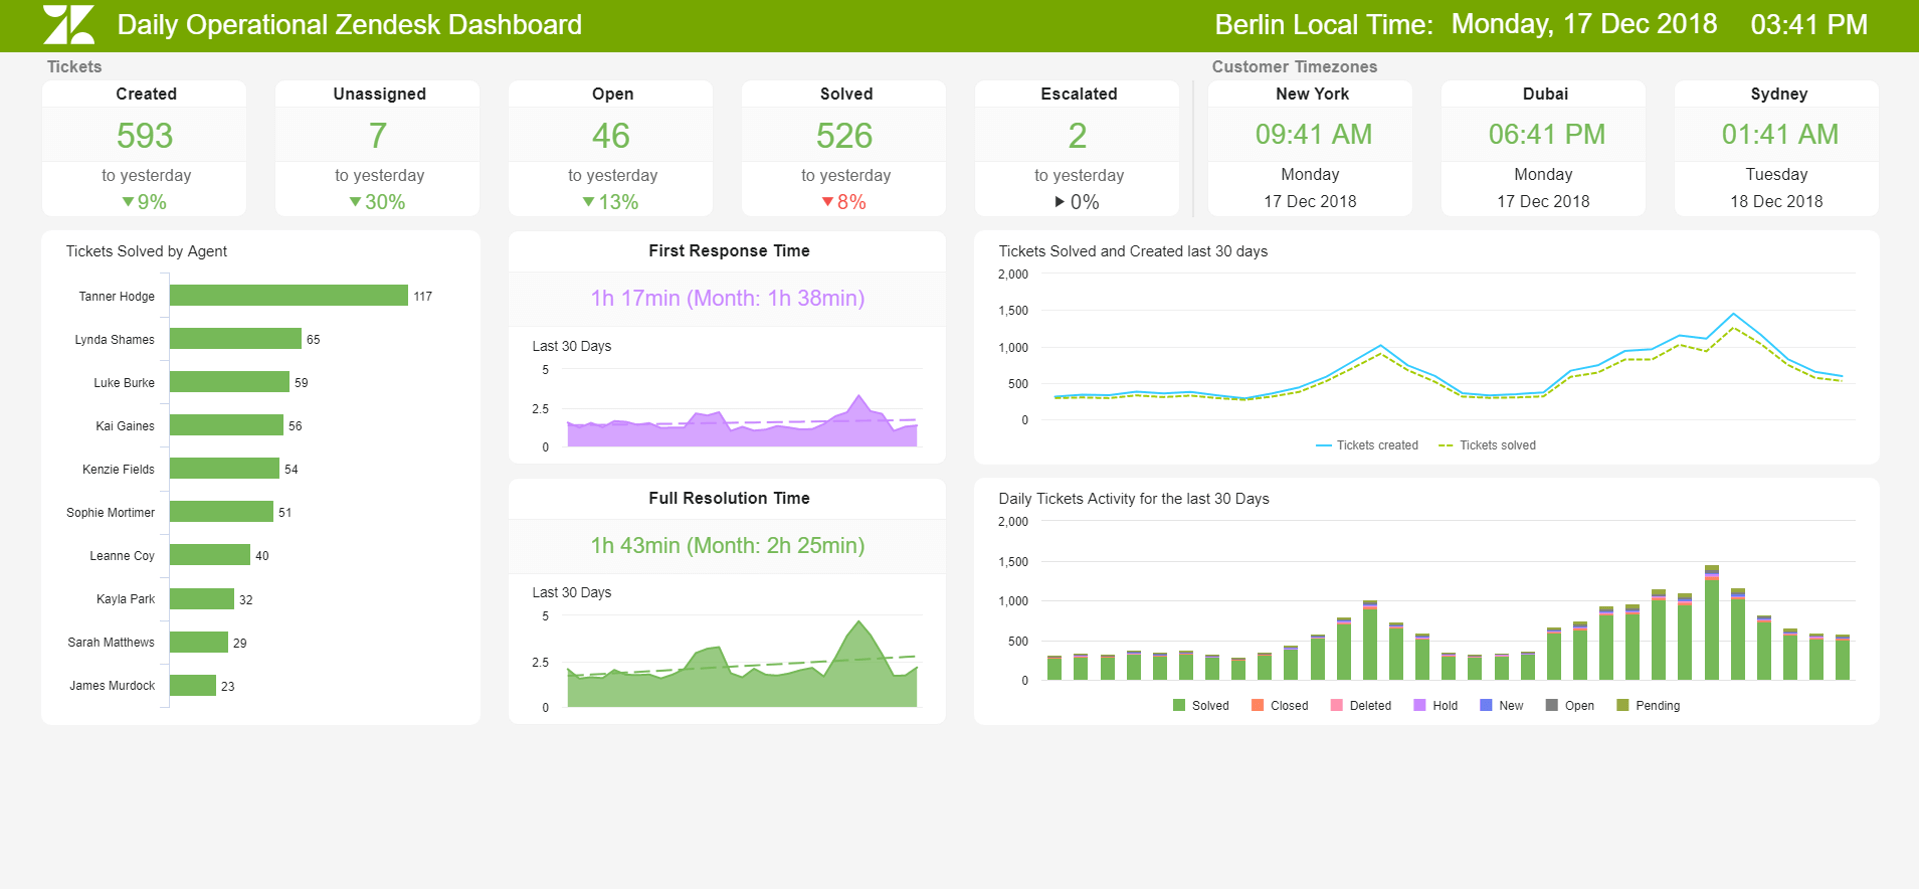
The agent performance scorecard dashboard delves into individual agent performance metrics, such as average handle time, resolution rate, and customer satisfaction ratings.
By monitoring these metrics, you can identify top performers, pinpoint areas where agents might need additional training, and ensure consistency in service delivery.
Target Users: Customer Service Teams, Managers
Essential KPIs:
Source
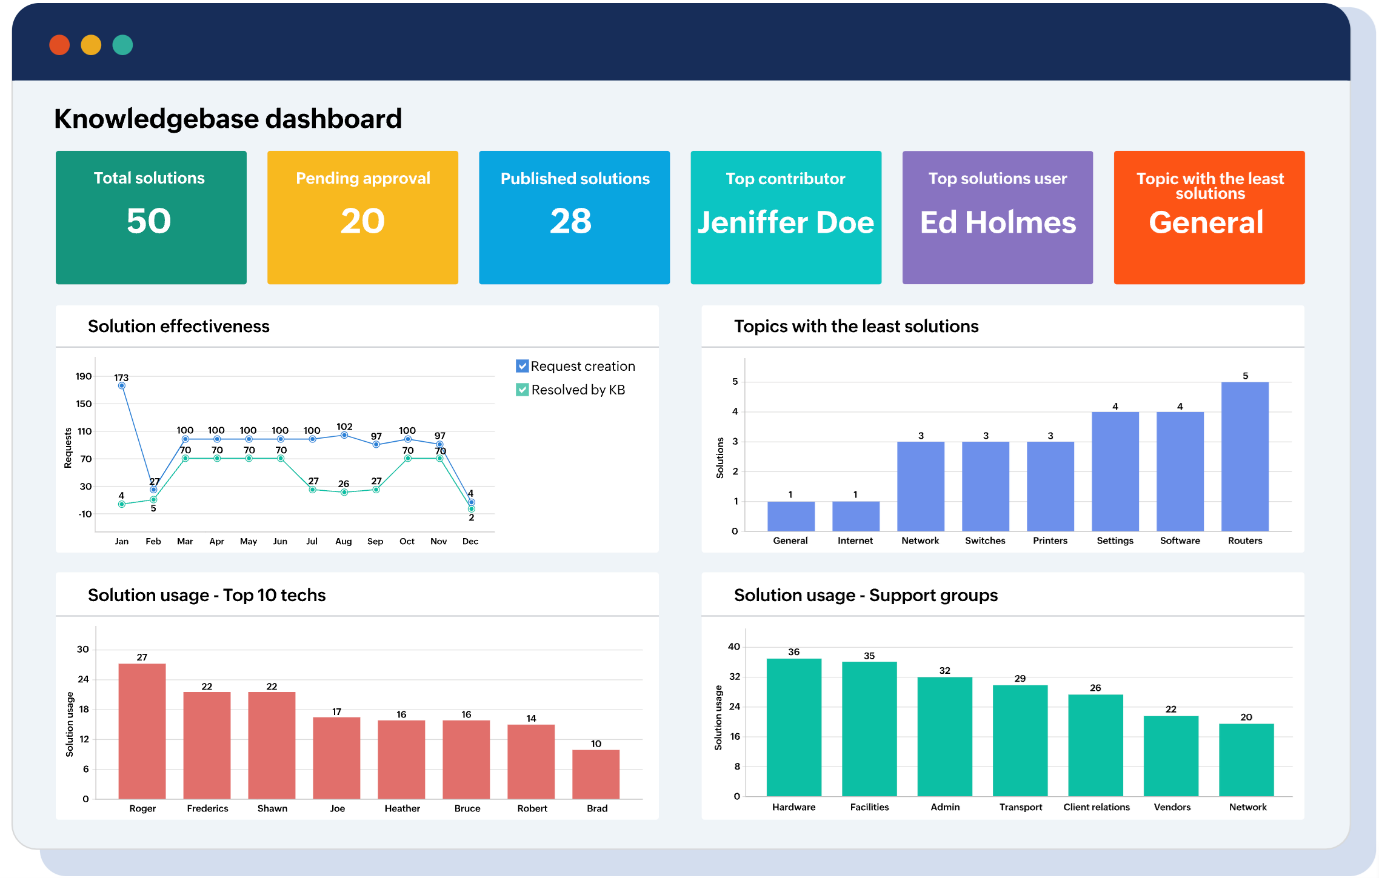
While many customer service dashboards focus on agent performance and ticket resolution, a knowledge-based usage dashboard offers a valuable and often overlooked perspective.
This dashboard tracks critical metrics related to your self-service knowledge base, such as:
By analyzing these metrics, you can:
Target Users: Customer Service Teams, Product Managers
Essential KPIs:
Source
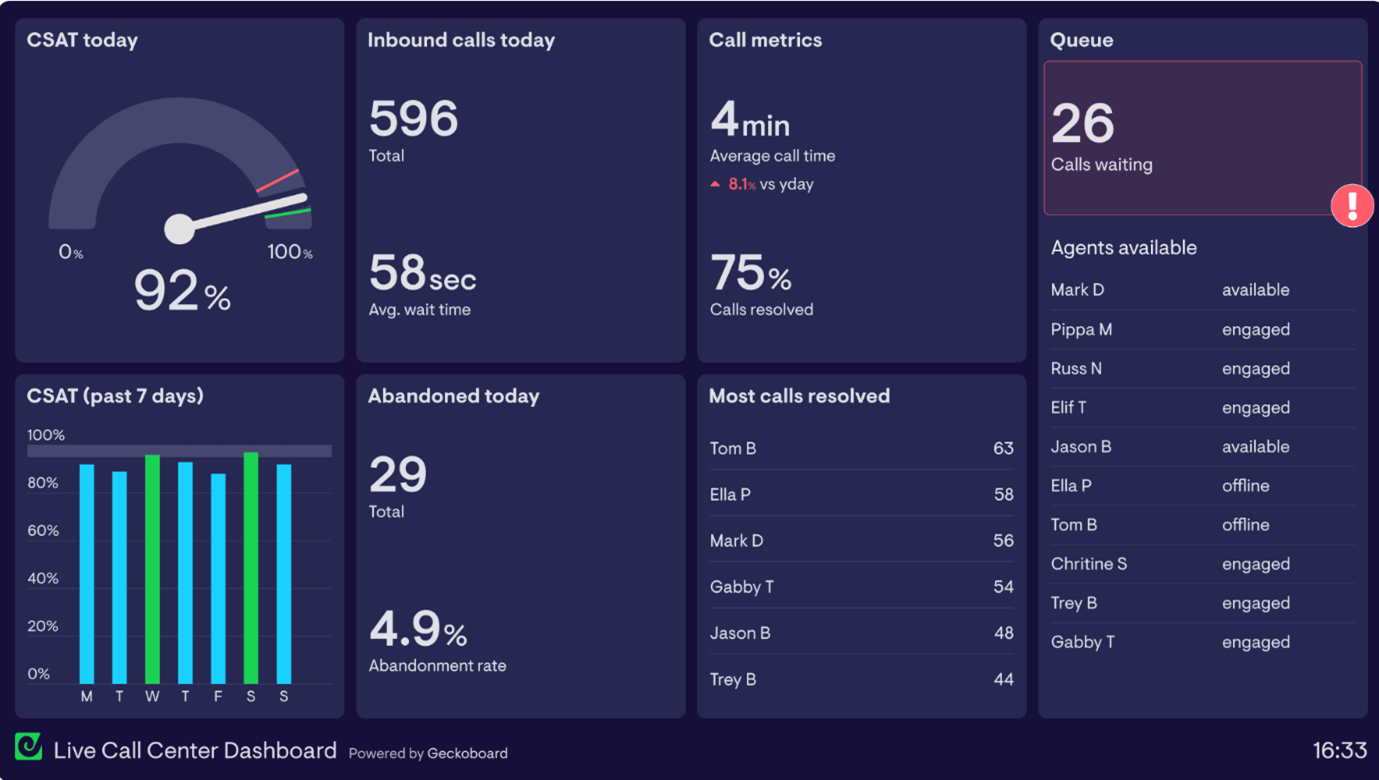
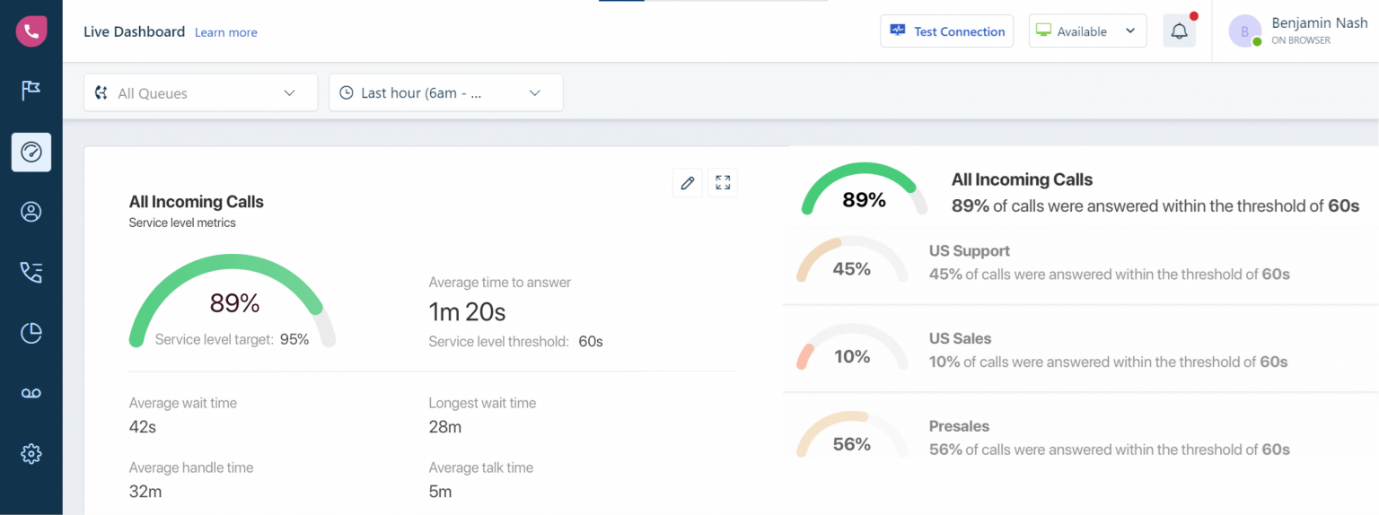
The call center KPI dashboard can be beneficial if your customer service teams primarily focus on addressing customer complaints or outreach via calls.
It allows teams and team leaders to understand team performance based on the number of call volumes, the outcome, and the resolutions over a period of time. This helps to understand how efficient your team is and how effective they are with customer resolution, providing a holistic understanding of speed and efficiency.
Ideal for: Call center team, support team leader
Essential KPIs:
Read more about various call center KPIs and how to track them effectively.
Source
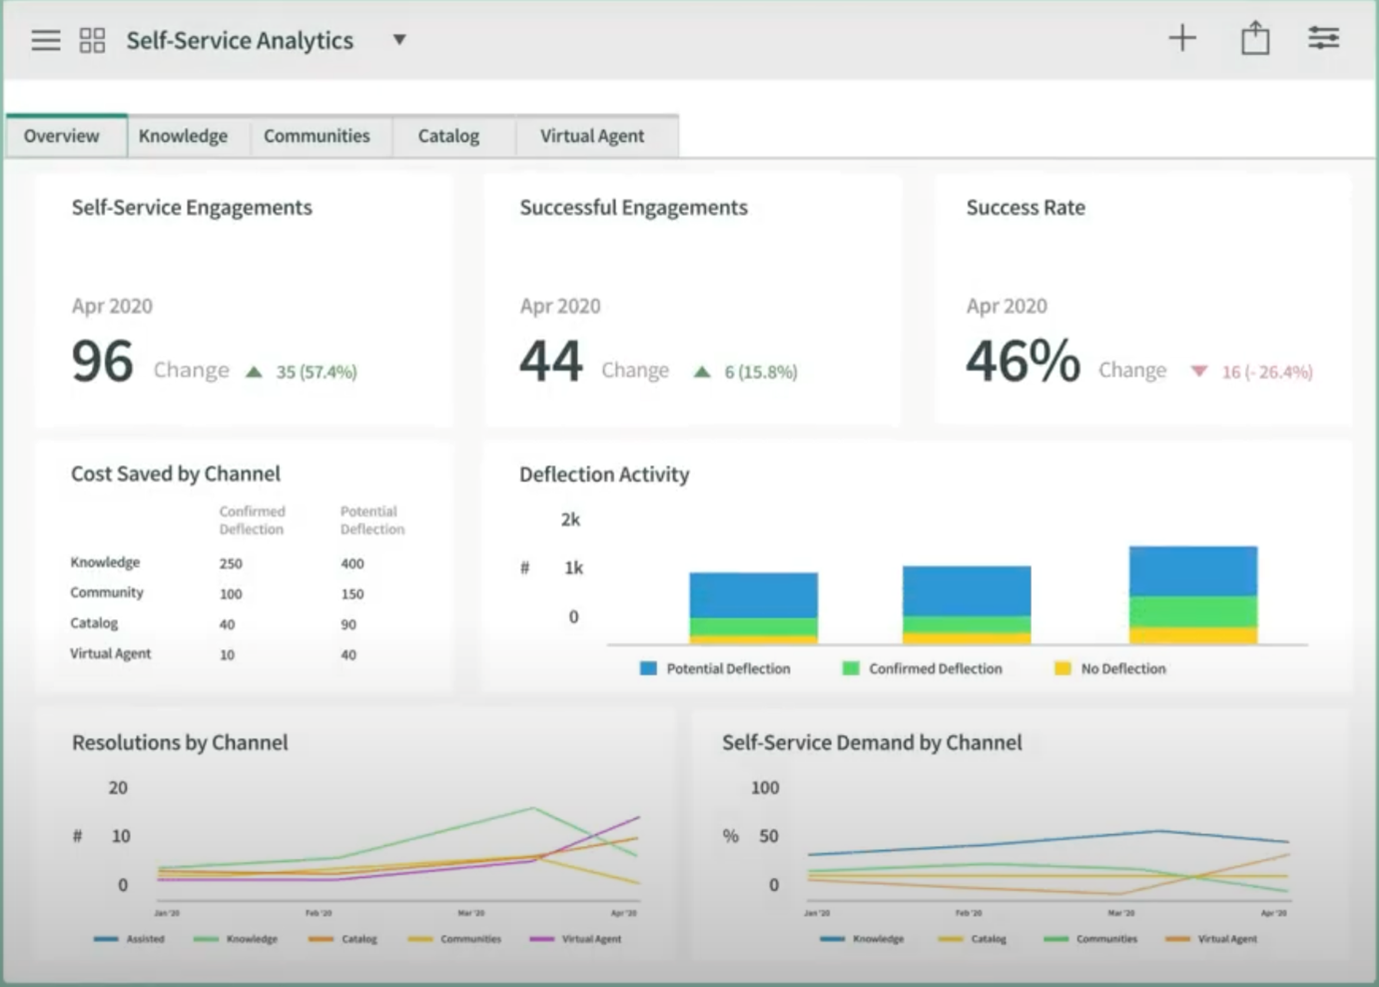
A self-service analytics dashboard provides valuable insights into how customers interact with your self-service options, such as FAQs, chatbots, or interactive tutorials. This is ideal for SaaS companies that focus heavily on enabling their customers to solve their issues themselves.
The dashboard helps by analyzing how your customer interacts with your resources and self-service options, helping you identify areas for improvement, optimize your self-service offerings, and empower customers to resolve issues independently, which ultimately reduces agent workload and improves overall customer satisfaction.
Target Users: Customer Service Teams, Product Managers
Essential KPIs:
Source
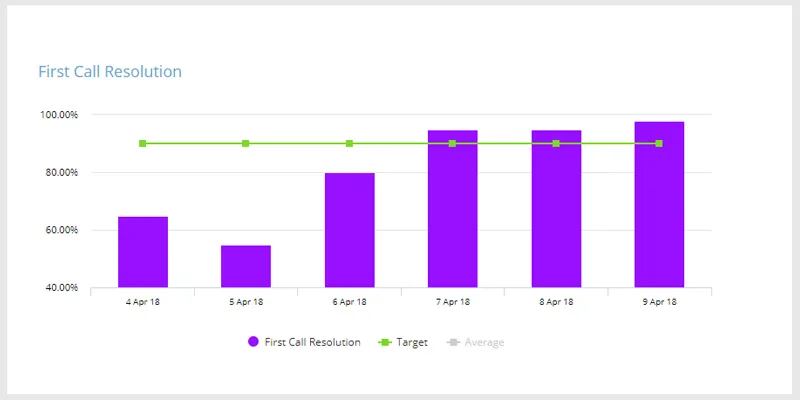
The FCR rate measures the percentage of customer issues resolved in the first interaction. This dashboard tracks this metric over time, allowing you to identify areas for improvement in agent training or knowledge base content.
Target Users: Customer Service Teams, Product Managers
Essential KPIs:
Source
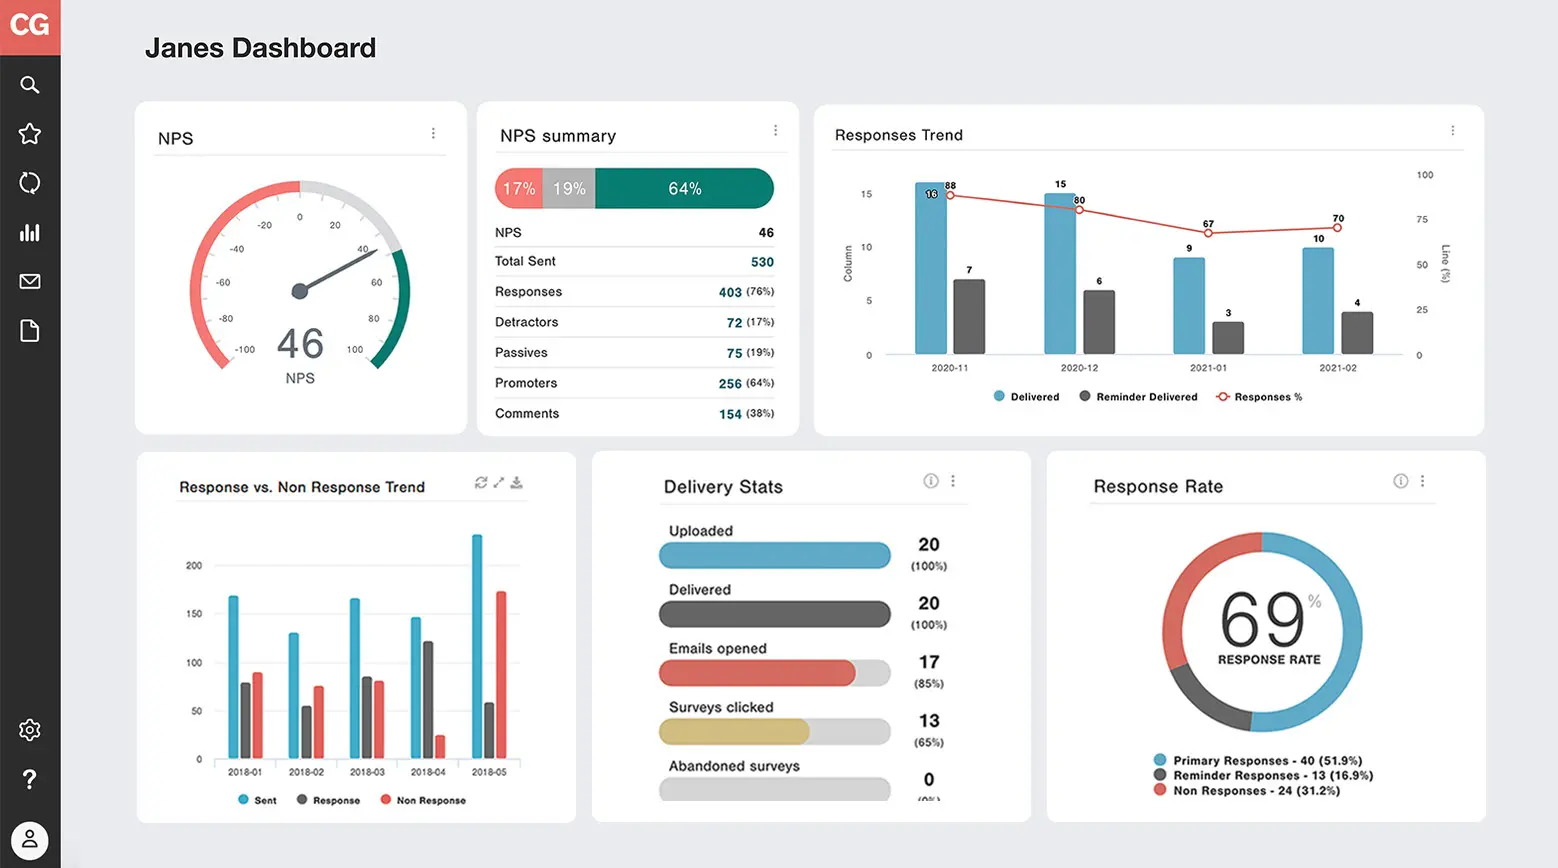
The NPS measures customer loyalty and their likelihood of recommending your brand to others. This dashboard tracks your NPS score and provides insights into customer sentiment.
A high NPS score indicates a solid customer base and high loyalty. However, a declining NPS might necessitate investigating customer feedback and identifying areas for improvement to prevent customer churn.
Target Users: Customer Service Teams, Product Managers (secondary)
Essential KPIs:
Source
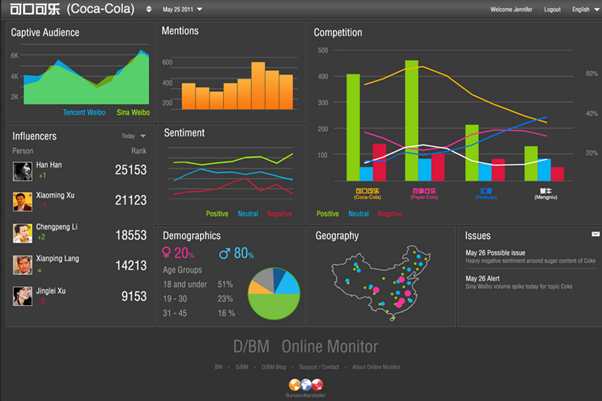
Social media is a powerful platform for customer feedback. This dashboard analyzes the sentiment of social media conversations about your brand, providing insights into customer perception and identifying potential concerns.
Target Users: Customer Service Teams, Product Managers
Essential KPIs:
While you can pick and choose the dashboards according to your requirements, the idea is to use them to make data-driven decisions.
Here are a few steps to help you create a proper customer service roadmap using your dashboard:
The first step to leveraging your dashboard properly is to define your specific objectives for implementing it. Do you want to improve agent performance, boost customer satisfaction, or gain a deeper understanding of your omnichannel support landscape? Clearly defined goals will guide your selection of relevant metrics and dashboards.
Look for a customer service platform that offers user-friendly dashboard creation tools. This includes features like a drag-and-drop interface with pre-built templates and real-time data integration, allowing you to build and customize dashboards without any coding expertise.
With your goals in mind, choose the metrics that will provide the most valuable insights. Consider including a mix of operational metrics (ticket volume, resolution time), customer satisfaction metrics (CSAT score, NPS score), and agent performance metrics (average handle time, resolution rate).
Dashboards are most valuable when used regularly. Schedule regular team meetings to review key metrics and discuss trends. Use these insights to identify areas for improvement and make data-driven decisions to optimize your customer service operations.
Customer service dashboards are a game-changer for businesses seeking to elevate their service experience. But having the right tools at your disposal unlocks their full potential.
Building dashboards from multiple tools and platforms becomes a hassle for most organizations, given the technical expertise and skillset required.
LeadSquared is a platform that not only helps you build dashboards but also includes robust sales and marketing features. This all-encompassing CRM tool is designed to streamline your workflows, empower your agents, and even engage your customers through self-service options.

Here is a look at some of the features of this platform:
The easy-to-use drag-and-drop customizable dashboard builder also lets you fine-tune the customer service dashboards to your unique requirements. This empowers your agents with the tools they need to resolve issues quickly and efficiently and helps deliver exceptional services to your customers to make them keep coming back for more.
Ready to experience the LeadSquared difference? Book a demo today or explore our service CRM features to learn more about how our platform can help you transform your customer service!
Each dashboard we have discussed focuses on some aspect of customer service, from understanding customer satisfaction to maximizing agents’ productivity and ability to solve customer issues.
With the right dashboards and sales platforms, you can steer your business in the right direction, providing exceptional customer experiences to delight customers and ensure they keep returning for more.
More in this series:
Customer service dashboards are powerful tools for identifying trends and patterns. By analyzing metrics over time, you can pinpoint areas where customer satisfaction is lagging, agent performance needs a boost, or self-service options require optimization.
The update frequency depends on the data being displayed. Real-time or near real-time updates are ideal for monitoring key performance indicators (KPIs) like current queue volume or agent availability. For trends and historical analysis, weekly or monthly updates may be sufficient.
LeadSquared is an excellent choice for building a customer service dashboard. It offers an intuitive platform with features like pre-built templates and drag-and-drop functionality. This enables you to gain valuable insights into your customer service operations and customize the dashboard to meet your specific needs effortlessly.


 9 Freshdesk Ticketing System Alternatives & How to Choose (2025)