


SALES
What is Sales Analytics? [Benefits, Types, and Metrics to Track]
Contents

Analytics has become an integral part of life, from finding the shortest route to work to forecasting stock market trends.
Analyzing previous trends ensures that businesses always make the right decision. And as the scale of the decision and its impact magnifies, more robust analytics need to take over. The gut feeling cannot cut it anymore.
According to McKinsey, businesses that rely on data to make decisions are 19 times more likely to be profitable. It’s no surprise that sales, a number-driven aspect of business, benefits from the right analytics. If your goal is fast and sustainable growth, your sales team must make quick and accurate decisions to improve its performance.
Sales analytics isn’t a new term. Businesses have been using it for years to optimize various steps of the sales cycle. But most of them are just at the tip of the iceberg when it comes to intelligent sales analytics.
This article aims to help you identify appropriate sales analytics to resolve business challenges.
Sales analytics refers to the use of technology to collect and use sales data to derive actionable insights. It is used to identify, optimize, and forecast sales. It uses different metrics and KPIs to plan an efficient sales model that generates higher revenue for the business. Here’s how Prashant Ahlawat, Vice President – Analytics and Transformation, at LeadSquared, defines sales analytics:
“Sales analytics is a compass for your sales teams. It guides you towards growth using tools that track past data and current performance against goals. The analytics reports then help you plan targets in the future.”
Sales involves many stages with their own set of metrics. There’s always an abundance of data to track, but it’s hard to make sense of it every time.
While you may want to use data to find gaps in your sales processes, it’s next to impossible without the right tools.
One such tool is sales analytics. It can help you identify gaps and improve your sales processes.
Let’s take a closer look at it.
Sales reps need to always be on their toes to achieve results. Sales processes are often complex. You’ll find several hurdles between lead gen to closing a sale.
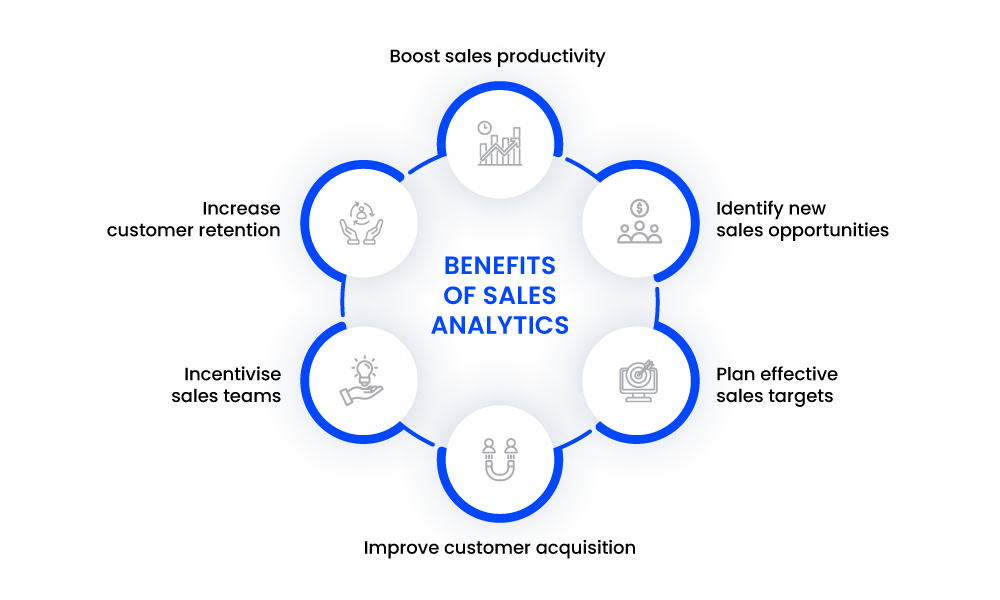
Data analytics in sales help managers decrease the sales cycle length by identifying the areas of improvement. Along with an average 20% increase in sales productivity, analytics also helps salespeople decrease leakages in the sales pipeline.
As a business grows, products evolve, new sales opportunities emerge. Tracking sales data helps enterprises understand the product fitment across industries and regions. The historical data allows salespeople to define their customer base and introduce opportunities to upsell and cross-sell.
Sales data—deals closed, qualified opportunities, length of sales cycles—captured over a year or even a quarter, can significantly improve the way businesses strategize their sales targets.
Predictive analysis helps forecast sales revenues and set individual targets based on your sales team’s performance.
Personalized customer journeys are hard to build without insights into customer behavior. The customer’s journey has multiple touchpoints, which can be improved by tracking factors like time on a certain website, tone during the call, and response rate. Customer analytics help salespeople make relevant recommendations, and over 44% of businesses use it to acquire new customers.
Incentives are the biggest motivator for sales teams. But you can’t reward their performance without accurate records.
Recording sales activities and their outcomes help businesses incentivize their sales teams fairly. Analytics simplify payroll management and help managers choose an appropriate sales commission structure.
Every business aims to improve their Customer Lifetime Value because acquiring a new customer is 5X more expensive than retaining one. And that’s precisely what sales analytics help you achieve! Diagnosing the possible drop-off stages and taking preventive measures brings down the number of churned accounts.
So, now you know the benefits of sales analytics. And the first step to achieve them is to use the right type of sales analytics that align with your sales goals.
The scope of sales analysis is vast.
But it all boils down to choosing the right analytics and metrics that help you achieve your business goals.
Business analytics fall under four broad categories:
However, sales analytics are more specific to a business’ sales process. Let’s look at the 7 essential sales analytics and relevant metrics under each type.
Marketing research involves deriving data related to target customers, well-performing regions, and untapped markets. It is vital to launch a new product and begin sales in new geos.
The metrics to track are:
Product Sales Analytics can be highly effective for businesses with multiple or seasonal product offerings. It considers the performance of every product or service that the company offers. It helps the sales team identify the products to focus on based on the revenue and sales targets. The analytics can be tracked for a certain timeframe and demographic.
The metrics to track are:
Comparing these metrics across different products/services helps you ramp up sales or drop certain products.
Almost every business would want to track its sales effectiveness. The extent and type of analytics used to monitor teams vary across different industries and businesses.
Tracking productivity and sales effectiveness on a daily, monthly, and quarterly basis help in identifying your team’s scope of improvement.
The metrics to track differ as per the targets that the business has set and its sales workflow. B2Cs usually have a higher sales velocity and shorter sales cycles than B2Bs. But in general, here are a few metrics that B2Bs and B2Cs rely on.
The journey from a qualified prospect to a customer is mapped in the sales pipeline. But each stage in the sales pipeline can turn into a drop-off point if it isn’t properly tracked and analyzed. Sales pipeline analytics help you determine what slows down the conversions and what you can do to speed it up.
The metrics to track are:
(Also read: 32 Sales KPIs Every Manager Should Measure to learn more about the different sales performance metrics in detail)
Every business aims to grow faster, witness higher conversions, and create an unmatched revenue stream. Hours of planning, strategizing, and forecasting go into realizing these goals, but there’s no guarantee they’ll be met. Creating a sales strategy using analytics can’t assure the desired results, but the chances that you will meet them shoot up.
Forecasting growth while keeping all the variables in mind is highly complicated. Sales data from the past acts as a benchmark and every year the stakes are increased to ensure business growth.
Here are some of the metrics that help you set suitable targets for your teams:
Churned accounts can be discouraging for your sales teams. Also, it brings a steep drop in your annual revenue.
Churn analytics help you identify touchpoints with a higher drop-off rate and the accounts with a high churn probability. A lot of the churn metrics are qualitative or based on customer behavior. With this information, your salespeople can intervene to prevent churn.
The churn analytics can be divided into two categories, predictive and post-mortem. The metrics to track are interdependent for both these categories.
Once the account is churned, it is important to evaluate the factors that caused the churn to avoid them for other accounts. It is also known as the post-mortem of the churn.
Marketing Qualified Leads (MQLs) have high intent and can be easily converted into a customer by the sales team. Employing the right marketing analytics ensure that leads keep flowing into the sales funnel.
Usually, many campaigns and marketing activities run in parallel. Figuring out which strategy generates the highest ROI and brings in the greatest number of leads is extremely important. So, analyzing your lead sources and the effectiveness of each campaign helps the marketing team restructure their budgets to improve the volume of quality leads.
Now that we’ve discussed all the types of sales analysis methods, mapping them to your business analytics becomes extremely easy. This table sums it all up.
![sales analytics metrics as per business objectives what is sales analytics? [benefits, types, and metrics to track]](https://www.leadsquared.com/wp-content/uploads/2023/12/Sales-analytics-metrics-as-per-business-objectives.png)
You can bookmark this page or download this Sales Analytics Guide to share with your team.
Sales analytics carry the power to transform your business However, the general notion is analytics is a high-end and complicated matter that’ll take up a lot of investment.
But this isn’t true; you just need to identify what works for your business.
“Any business with a sales team needs sales analytics, irrespective of the industry or the complexity of your product. All KPIs that you set for your teams should be tracked and analyzed, even if you use the most basic reports.”
Murali Krishna, Vice President – Sales, LeadSquared
The biggest deterrents to using advanced sales analytics tools are the cost and the need for a well-defined sales process. However, sales analysis doesn’t always need a tool.
For businesses with small teams or a short and simple sales process, people-level analytics and sales effectiveness metrics should suffice. The business can effortlessly record and analyze this data on Excel sheets.
As the size of your sales team increases, Excel sheets begin to break. The amount of data increases exponentially and only a good sales analytics software can meet the requirements.
A sales analytics software is also essential if you have multiple product offerings that need to be mapped to customers.
“While a few industries can make do without a sales analytics software, it’s a basic requirement for others such as edtech, real estate, banking and insurance, manufacturing, and e-commerce.”
Pritika Khorana, Regional Sales Manager, LeadSquared
If you’re just getting started with sales analytics, the following courses and books could help!
1. LinkedIn’s Business Analytics: Sales Data
2. Sales Analytics Beginner Complete Course by Udemy
3. Wharton’s Business Analytics
1. The Power of Sales Analytics by A. Zoltners, P. Sinha, and S. Lorimer
2. Predictive Analytics: The Power to Predict Who Will Click, Buy, Lie, or Die by E. Siegel
3. Business Analytics: Data Analysis & Decision Making by S. Christian Albright and Wayne L. Winston
The right sales analytics can be a game-changer for your business. That’s exactly how Tricoci University of Beauty Culture, a Chicago-based cosmetology school, increased their process efficiency by 75%.
Here’s a little peek into their sales analysis journey with LeadSquared.
Tricoci University has 16 campuses spread across Illinois, Wisconsin, and Indiana. The school takes pride on its people-centric approach to preparing the leading beauty professionals of tomorrow.
An absence of sales and marketing analytics made it hard for them to improve their enrolment process quickly. Here’s when they chose LeadSquared as their CRM tool to meet their enrolment goals.
| Sales Analytics goals | LeadSquared solution | Results |
| Introduce touchpoints to regularly track and store data | Digital student enrolment journeys with a detailed view of the admissions pipeline. | Real-time tracking of the lead stage, intent, and activities. |
| Generate impactful insights from sales data to improve the enrolment process. | Ability to optimize enrolment workflows using sales and marketing data. | Improved process efficiency by 75%. |
| Improve the productivity of their enrolments team. | 150+ marketing and admissions reports with various performance metrics to evaluate the team. | Highly productive sales teams. Improved remote team management. |
The sales analytics journey will be impactful only when the data trends are visualized and reported. There are a few ways to go about this. You can either integrate your sales data with a visualization and reporting tool—like Tableau, Microsoft Power BI, or Qlikview— or you can opt for a CRM with reporting tools.
Both these options work great for businesses, but a CRM with sales reporting abilities is more convenient and financially feasible. LeadSquared CRM, with its advanced reporting tools, is a one-stop solution to track and visualize sales data.
Watch our Masterclass on LeadSquared Reports & Analytics to understand the different types of reports that you can generate on the LeadSquared platform.
Every business intends to use its sales analytics software for different purposes. And there are many that you can choose from.
A sales analytics tool tracks and analyzes sales data to make actionable improvements. But choosing the right tool for sales analysis is imperative. Here’s a checklist of the features that you should evaluate before you purchase a new sales analytics software.
The tool should be able to visualize your sales data in every way possible–charts, tables, graphs, or tables. It’s important to note that the visualization must be real-time and easy to generate and access.
Can the tool handle the data when your team and the number of leads increase by 10X or 15X? If you aim to grow rapidly, it’s important for the tool to scale along with your business.
Loss of data, whether it is process-related or sensitive lead information, can affect your business negatively. The platform should be secure enough to prevent data leaks and the loss of important information.
Sales data is generated by the minute. So, your sales analytics software must always stay operational. The core engine should be robust enough to carry out all the calculations and handle reports even when lead volume peaks.
The insights must help you make decisions both on a short and long term. For instance, on a daily/weekly and on a monthly/quarterly/yearly basis. So, the software must consistently record and update the data.
I hope this article helps you streamline your sales analytics strategy to resolve any business challenges you may face. To sum it up, sales analysis is all about putting your data to work to improve sales outcomes. With the right tool, sales analytics can completely transform your business.
A CRM is one such tool to track sales data, record it, and derive insights from it. If you’re looking for a CRM with advanced monitoring and reporting capabilities, you should give LeadSquared a shot!
Book a demo to know more about LeadSquared’s Sales CRM.
Sales analytics is used to identify, optimize, and forecast sales. It uses different metrics and KPIs to strategize a sales model that is efficient and generates high revenue for a business.
Sales data that is tracked on a CRM can be used to generate insightful reports. These reports help you boost sales productivity, increase customer retention, improve sales strategy and generate a high lead volume. The CRM analytics also highlight the products and markets that your sales team must focus on.
Business analytics fall under four broad categories—descriptive, diagnostic, predictive, and prescriptive. They take both qualitative and quantitative factors into account and help your business achieve rapid growth.
Enter your details and we'll send you a quick confirmation email to verify your address.


 Practicing Patient Appreciation: 7 Ways to Show Patients You Care