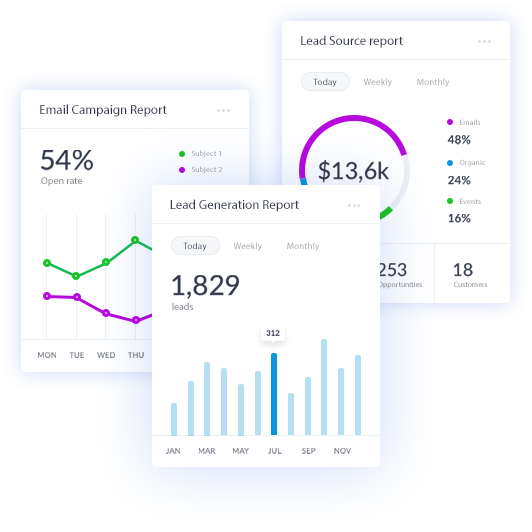
A Sales metrics dashboard presents a visual interpretation of business data and sales performance. In this day and age of high competition, it is important to keep measuring the health of your business. Not only does this help you grow, but it can also help you keep a check on any red flags.

Setting up a sales metrics dashboard can have direct impacts on your sales team such as sales productivity and efficiency. This article discusses briefly how exactly you can do this.
How Do Sales Metric Dashboards Work?
A sales metrics dashboard provides a birds-eye view of sales performance statistics by combining data collected from key performance indicators (KPIs). Each KPI is collated and displayed as a single metric on a dashboard accessible by all interested parties.
The sales metrics dashboard can then be used as a foundation to create actionable insights, track quotas, and measure activities. They can also be used to measure progress towards goals, plan for follow up sales activities, and assess the performance of a team or an individual.
When a sales dashboard is regularly updated, business owners will benefit from an up-to-the-minute visual representation on the state of their company. If there are any issues, a dashboard will highlight the areas which require attention.
Sales metric dashboards do not replace a CRM. Instead, they pull the relevant data and display it in an easy to consume format.
How are Sales Metric Dashboards Used?
Dashboards can be used to provide different kinds of visual information, including:

Company Reports:
Business owners who need answers to questions such as the number of deals won and lost, or a forecast on next month’s revenue. The answers to these types of questions provide valuable insight into how effective (or ineffective) a newly implemented sales strategy may have been.
Tracking Individual Performance:
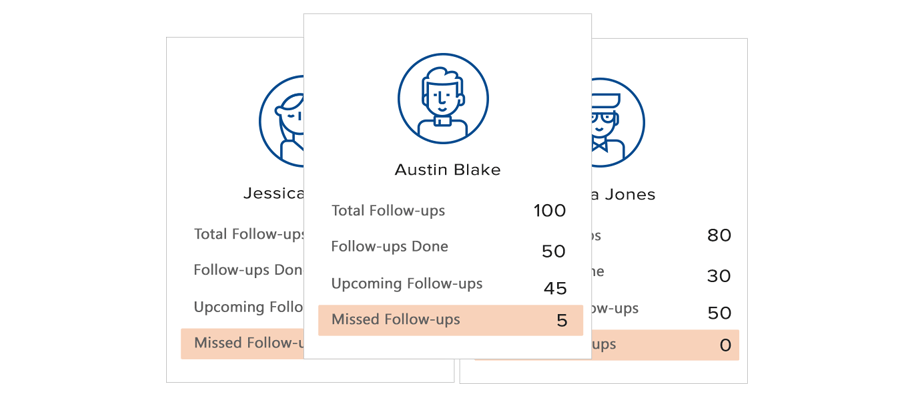
A salesperson can review their performance and get updates on how close they are to their goals or quotas. Other metrics, such as conversion rates may also be displayed.
Sales Team Reports:
Sales team reports are used in a similar way to individual reports but at team scale. Large organizations will find it more useful to track a few sales teams, rather than many single individuals. The leader of each group will then be responsible for monitoring performance at an individual level.
Sales Metric Dashboards Which Can Boost Your Sales
Sales metrics dashboards are versatile tools that can help steer a sales team towards a goal and keep everyone working to the same agenda. Dashboards can differ in the information they deliver, so here’s a brief outline of the versions which may provide a benefit to your organization.

1. Yearly Progress
Sales is a competitive field. Not only are your salespeople competing against competitors and fellow salespeople, but they are also in competition against their last year’s performance.
A YTD comparison dashboard can help them keep track of their progress and compare it against where they stood at the same time last year. The goal is to keep this year’s line above last year’s line.
2. Largest Upcoming Sales
The bigger the sale, the closer you get to your sales goal or quota. A sales metric dashboard can be set up to provide a quick visual guide about the biggest sales coming up.
You now have the information you need to prioritize the sales which are going to yield the biggest rewards.
3. Sales Cycle Dashboards
A sales cycle is an essential but straightforward metric on which to keep tabs.
Being able to gauge how long a sale will take to process can help companies better manage the critical stages of the sales pipeline, such as when a quote will need to go out and identify and eliminate bottlenecks.
The sales cycle metric can also be used to highlight sales which are about to become dead in the water. Sales that are taking longer than the usual cycle can be nudged along by offering discounts or by adding value in some way.
Individual team member’s performances can be compared against the standard sales cycle. If a salesperson regularly extends the process beyond the usual timeframe, the dashboard can provide valuable insight into where they may be able to make improvements.
Likewise, the methods used by members of the team who regularly beat the clock can be implemented with other sales reps and bring everyone up to speed.
4. Track Sales Activities
Knowing where team members are spending most of their time is a valuable metric to help improve performance levels or discover areas where they may not be prioritizing as efficiently as they should.

Performance indicators regularly found on this type of dashboard include the number of emails sent, phone calls made, and appointments set. The metrics of the dashboard can then be used to highlight areas where a team member would benefit from extra training or steer them away from sales with a low chance of success.
5. Lead Response Time
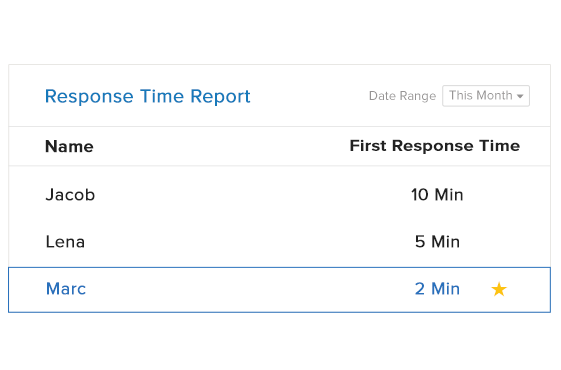
Quickly responding to new leads entering a sales funnel is a major part of improving conversion rates.
InsideSales tells us that there is 100 times difference in closure rates when sales rep responds within 5 minutes rather than 30.

Regardless of the business, catching a lead when they first land on your site can make or break a sale. A sales metric dashboard supplies the critical information you need to improve response times.
6. Product Performance
Product performance creates a visual indication of which products are doing well and producing most of the sales. Inferior performance should also be available so you know which products or services to drop, or reduce the resources spent on them.
When monitoring the product performance metric, you must also consider the context which may be influencing the sales. For instance, are sales peaking because of a viral marketing campaign? Are sales experiencing a slump because a competitor came out with a similar product at a lower price, or incorporated more advanced features?
7. Sales Closing Ratio
The sales closing ratio is a record of how many deals were closed versus the number of prospects engaged. It’s an excellent metric you can use to gauge the overall efficiency of your sales funnels.
The metrics you will use to monitor the sales closing ratio will be the number of quotes which are sent out versus the number of sales closed.
In Conclusion
We’ve covered a few of the more popular metrics a sales dashboard can provide, but there are many more and what you use will depend on what is relevant to your industry and your organization.
Most small business owners are pushed for time, so will only choose to monitor numbers which have the most potential to improve the bottom line. The above examples provide an expansive view of the sales activities, without being difficult to implement.


![[Webinar] Maximizing ROI with WhatsApp CRM](https://www.leadsquared.com/wp-content/uploads/2024/07/Maximizing-ROI-with-WhatsApp-CRM-webinar-popup.gif)
