


SALES
Sales Dashboards: Types, Examples, and Templates
Contents

Understanding sales numbers is a big challenge that businesses face. It can often resemble a complex puzzle or a cryptic message that your team needs to decode.
Enter the sales dashboard—an indispensable tool to decipher sales data! It helps you understand the numbers and break them down into comprehensive reports and trends.
A sales dashboard provides a big picture of all the crucial metrics and performance indicators to assess how your sales teams are performing.
But, if you lack the right dashboard, visualization, or tools to track the information it leads to incorrect forecasts and a loss in sales revenue.
Now that we understand how important sales dashboards are, let’s explore strategies and tips to use them to our advantage.
A sales dashboard serves as a centralized tool for businesses, aggregating essential sales data into an easily accessible display.
Think of it as a control panel showcasing crucial sales metrics, such as revenue, units sold, and sales trends across different channels. This consolidated view helps businesses strategize growth by providing a comprehensive snapshot of sales performance.
Here are some key reasons why building a sales dashboard is crucial:
A sales dashboard acts as a compass for businesses, offering clarity and direction in the sales landscape. However, there’s no one-size-fits-all solution.
It’s essential for teams to identify their challenges and choose a specialized sales dashboard that addresses those needs.
The executive sales dashboard offers a comprehensive view of critical metrics and is used to make strategic decisions toward growth and profitability.
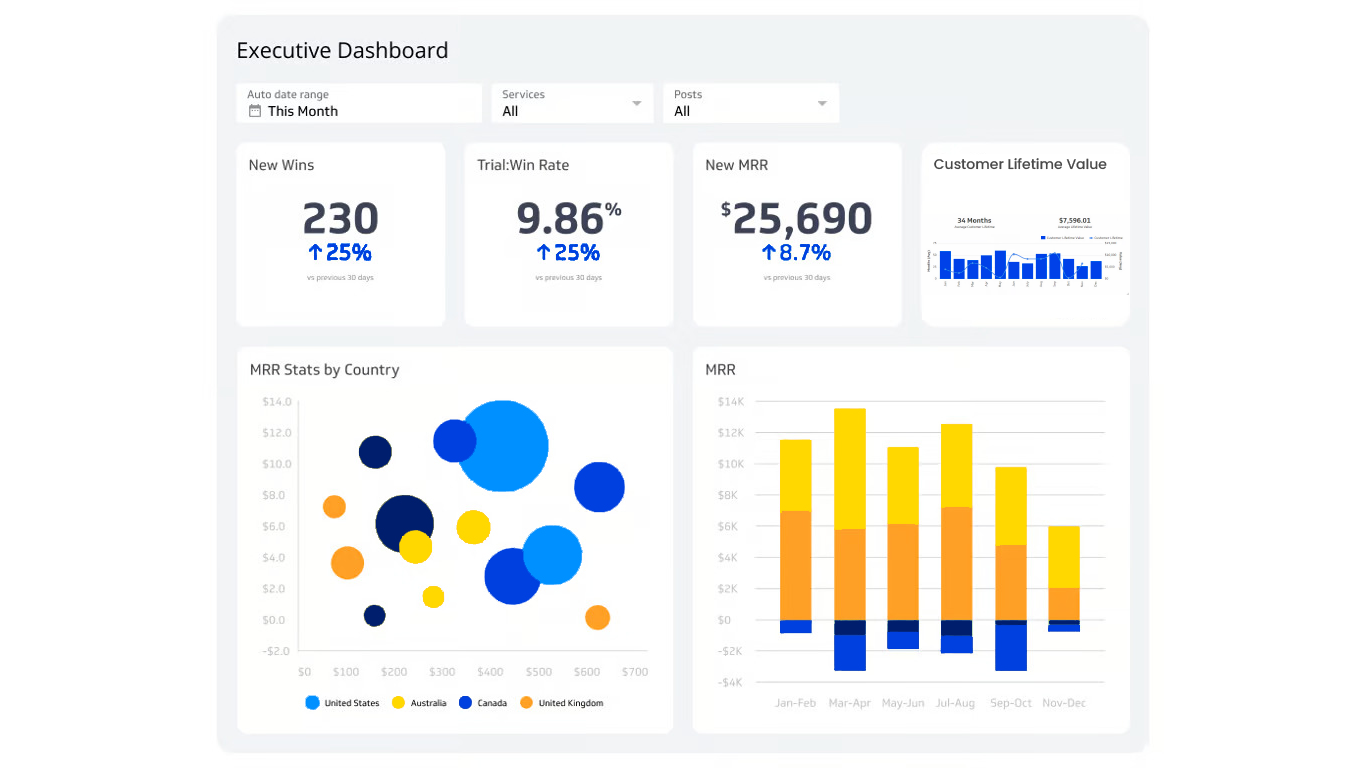
(Source)
This dashboard provides detailed insights into team performance. It allows managers to identify high performers and provide targeted coaching to the underperformers, based on their sales performance metrics.
Moreover, it aids in sales territory management by showcasing regional sales trends to allocate resources efficiently and adjust sales territories for maximum productivity.
Additionally, it assists in sales pipeline management by tracking lead conversion rates, allowing managers to intervene, provide support, and ensure a healthy sales pipeline for consistent revenue generation.
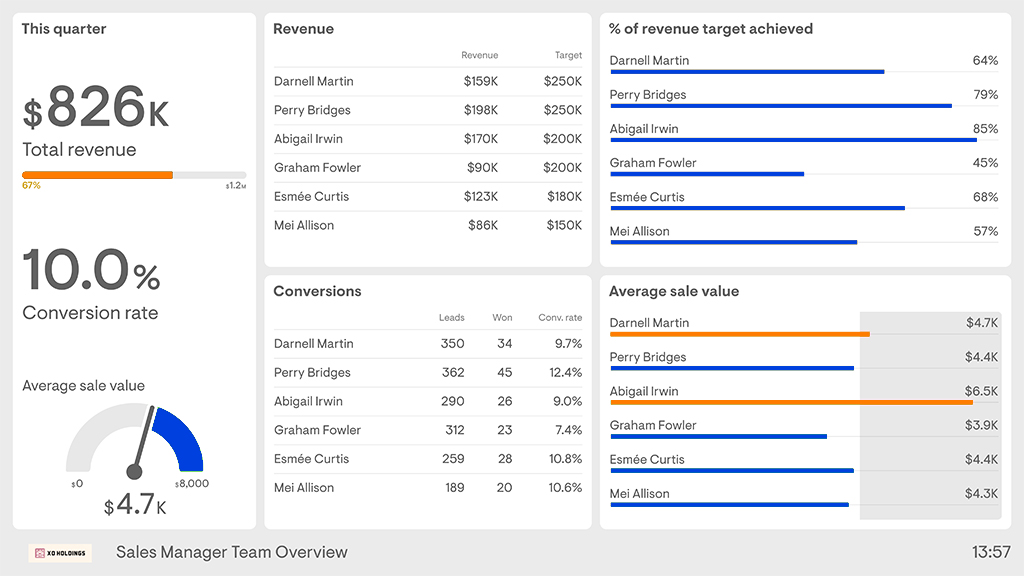
(Source)
“Dashboards help you compare data sets with different time periods, sources, teams and products. They give you a clear picture and help in executing with strategy which in turn helps with faster decision making. Sales dashboards have been extremely helpful in increasing my and my team’s productivity”
– Hiral Shah, Senior Growth Marketing Manager, LeadSquared
This dashboard acts as a translator between the sales and marketing departments. It serves as a common ground to align their efforts and outcomes while working towards shared objectives.
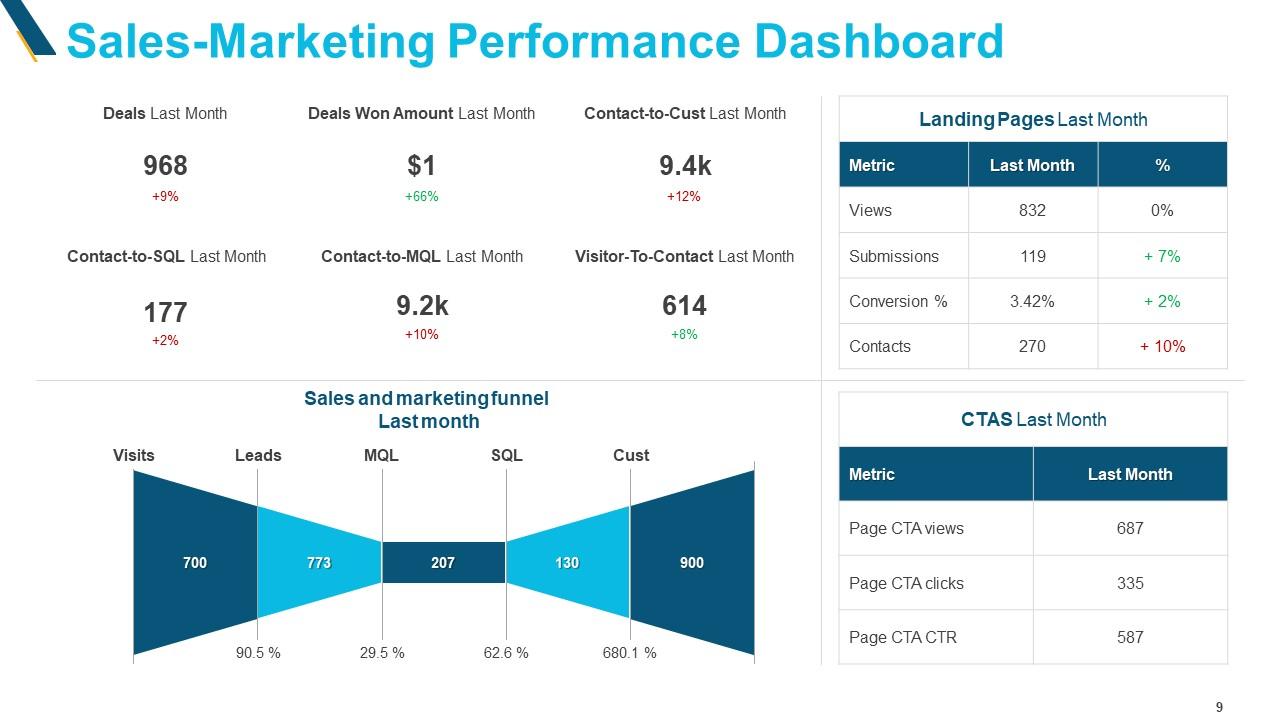
(Sources)
The customer success dashboard focuses on customer satisfaction and retention. It helps managers steer the team towards improving customer experiences and reducing customer churn rates.
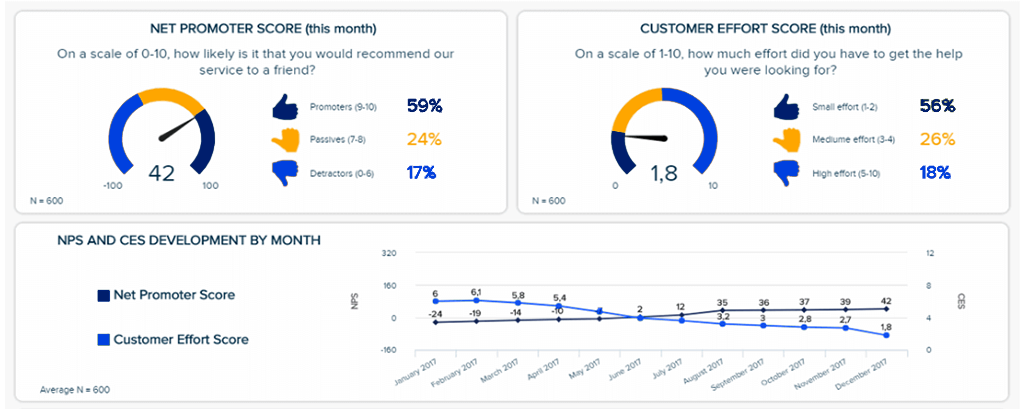
(Source)
The product performance dashboard drives product development strategies by highlighting user feedback, feature adoption rates, and usage metrics. It aids in steering product enhancements to meet user needs effectively.
The product performance dashboard is extremely relevant to salespeople too. By analyzing usage metrics, sales teams can predict user behaviour, and identify signals that indicate potential churn.
For instance: A decline in engagement or a decrease in feature usage might signify a user at risk of churning. This insight equips sales reps to proactively engage with these users to offer support or additional resources to retain them.
Moreover, understanding feature adoption rates from the dashboard helps sales teams identify opportunities for cross-selling or upselling.
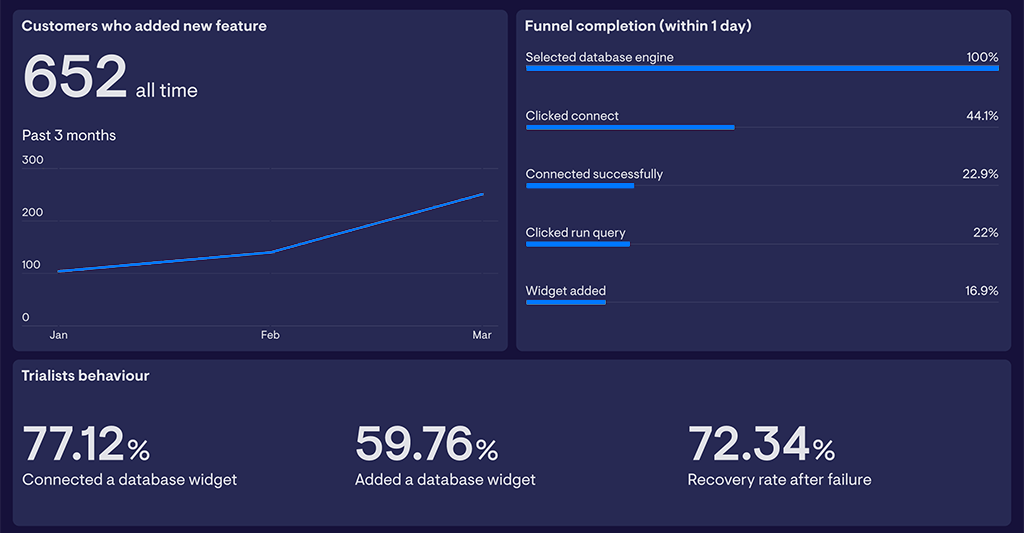
(Source)
The territory sales performance dashboard provides valuable insights into sales performance across different regions, enabling managers to tailor strategies for growth in diverse markets. It offers detailed analytics on regional sales trends, customer preferences, and revenue patterns.
This information empowers businesses to allocate resources effectively and manage inventory based on regional demands.
Moreover, the dashboard assists in identifying high-performing territories the regions that require focused efforts. By leveraging these insights, businesses can strategically adapt their approaches for better market penetration and enhanced sales outcomes.
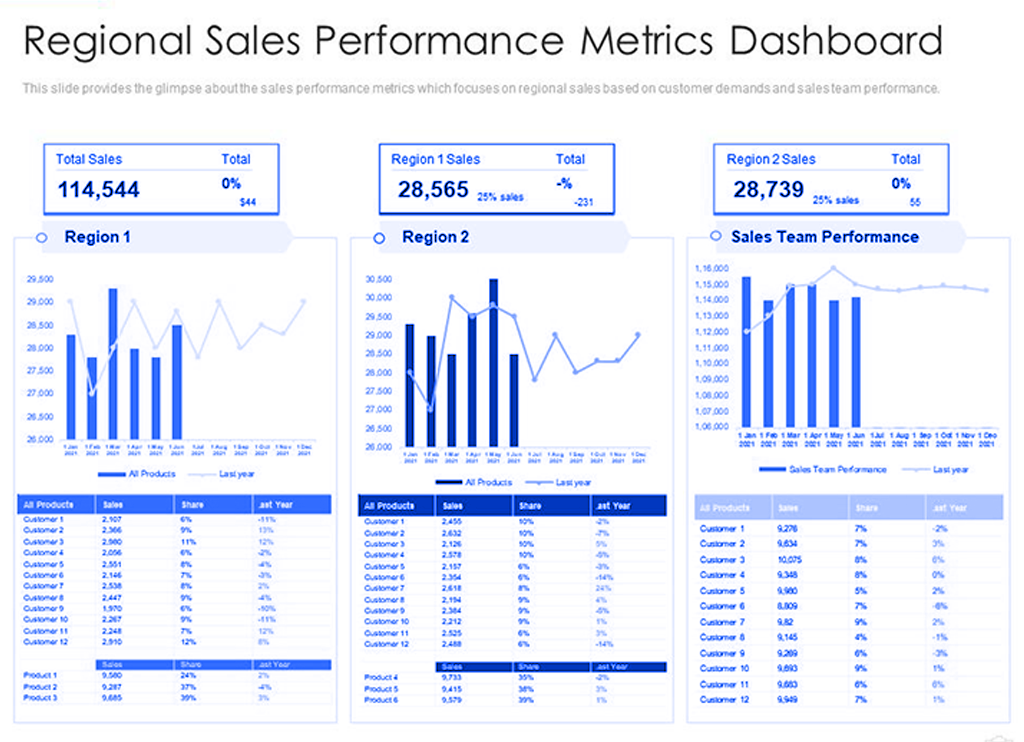
(Source)
The leads dashboard is a pivotal asset for sales teams, offering invaluable insights into lead management and conversion optimization. This tool helps identify and prioritize high-value leads by analyzing sources, behaviors, and engagement metrics.
Furthermore, tracking lead progression and time spent at each stage assists in pinpointing sales challenges, such as prolonged turnaround times or bottlenecks in the conversion process.
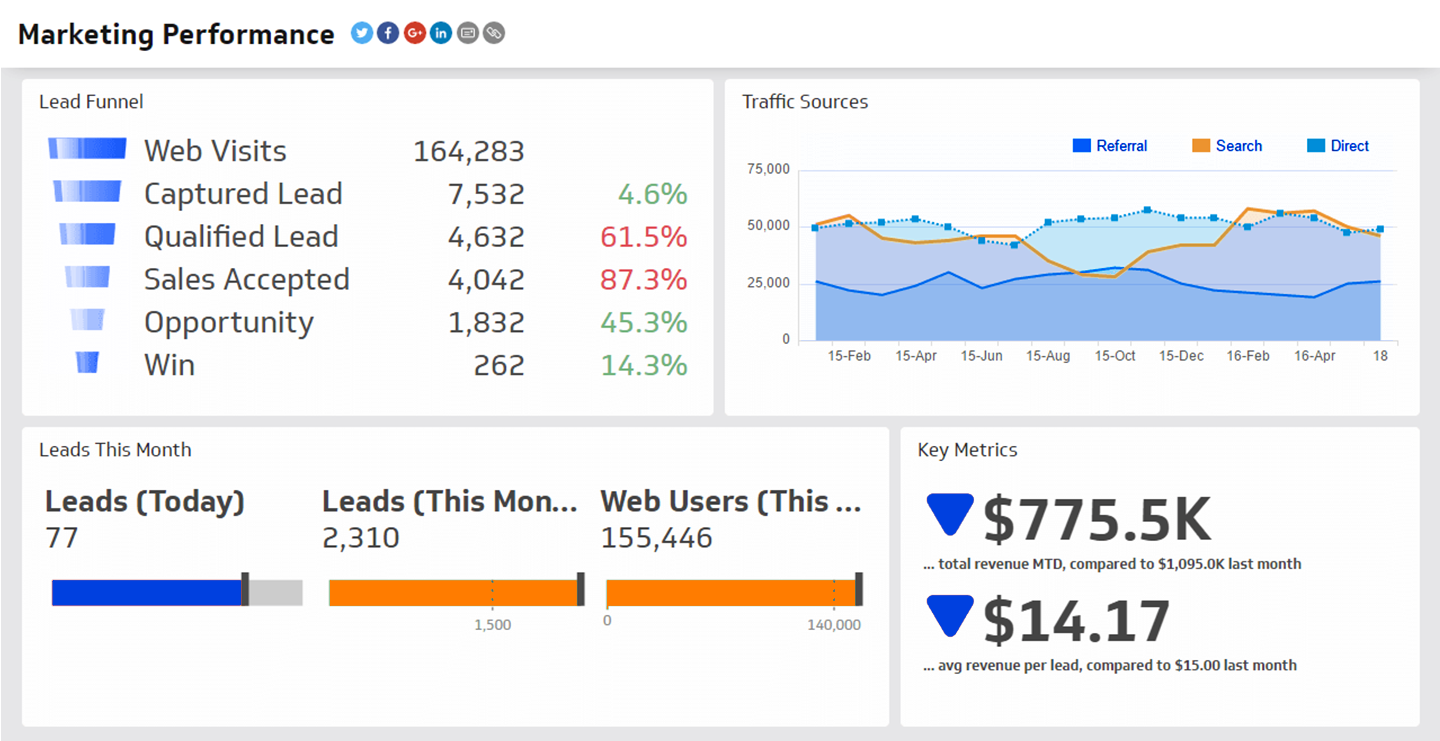
(Source)
The rep performance dashboard is a specialized tool designed for both sales representatives and managers, centering on individual performance metrics. This dashboard offers a comprehensive view of each sales rep’s performance, including key indicators like conversion rates, sales volume, customer acquisition, and sales cycle duration. It serves as a guide for personal growth, enabling reps to track their progress and identify areas for improvement.
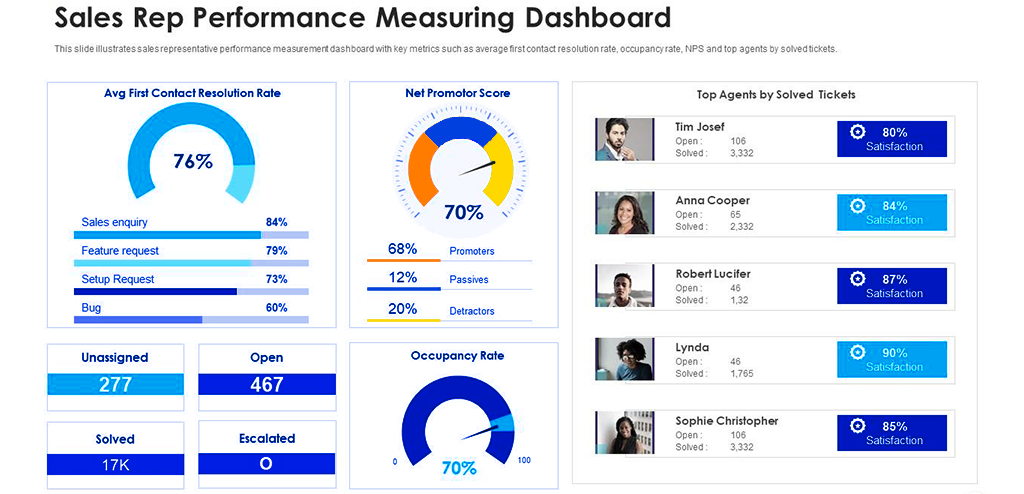
(Source)
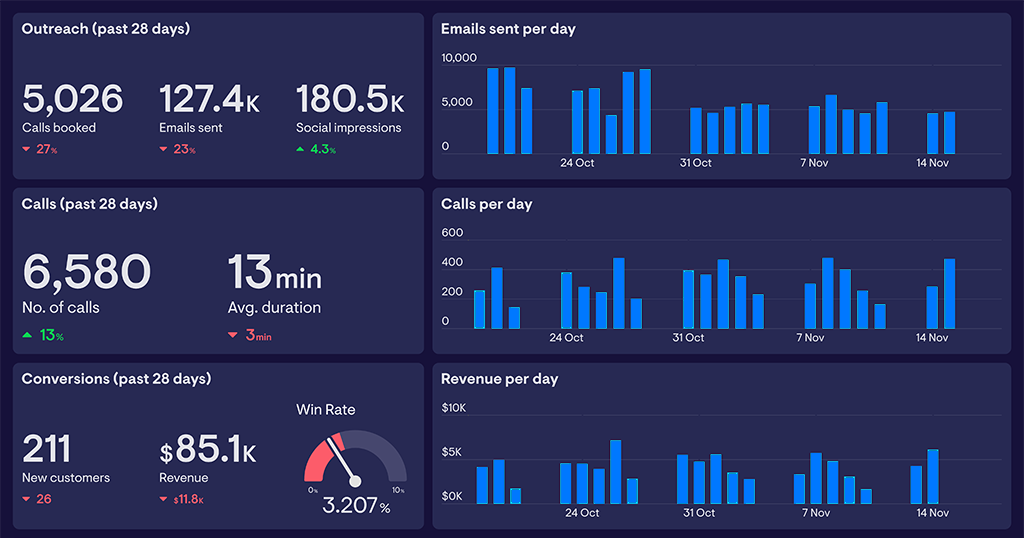
The sales activity dashboard serves as a dynamic tool, meticulously monitoring daily sales endeavors, and guiding sales teams to amplify their outreach strategies while enhancing sales productivity.
This comprehensive dashboard captures an array of key sales activities, including calls made, emails sent, meetings scheduled, and follow-ups completed. By meticulously tracking these metrics, sales teams gain insights into the effectiveness of their outreach efforts.
Moreover, it facilitates the identification of high-impact activities and time allocation for maximum efficiency. Sales teams can fine-tune their approaches, optimize workflows, and ultimately drive higher conversions and revenue generation using the sales activity dashboard.
(Source)
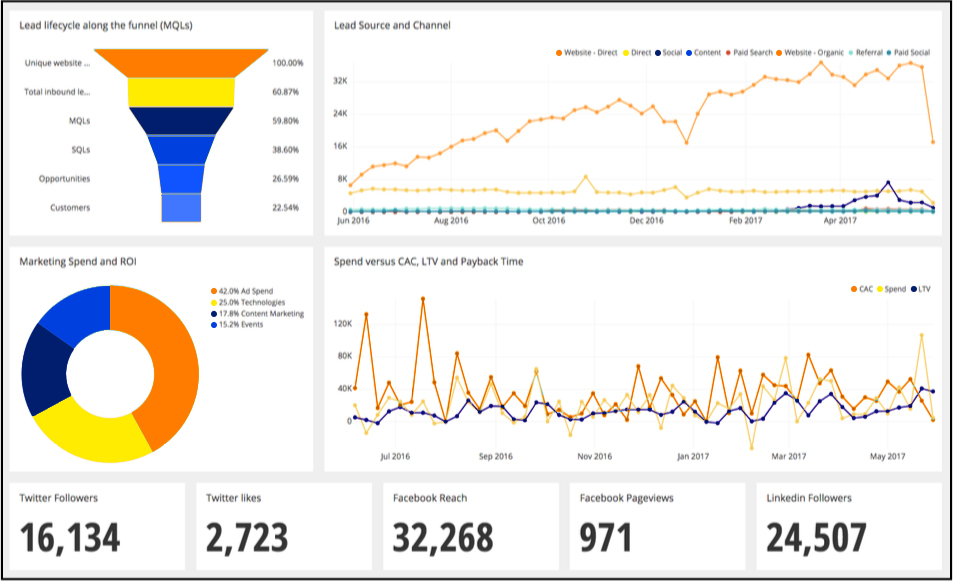
The sales funnel dashboard is a pivotal tool that visualizes and tracks the entire sales process, from lead acquisition to conversion. It offers a comprehensive overview of prospects at each stage of the sales funnel, allowing teams to assess conversion rates, identify potential bottlenecks, and optimize strategies for better outcomes.
This dashboard typically highlights stages like lead generation, qualification, proposal, and closure, providing insights into the volume of leads at each phase and their progression. Utilizing this tool, sales teams can pinpoint areas requiring attention, such as high drop-off rates between stages, enabling them to tailor their efforts to address these challenges.
(Source)
Now that we’ve read and explored multiple types of sales dashboards, let’s understand how we can build a perfect one.
A personalized dashboard makes it easier to see important information and helps you make smart decisions.
“By building a dashboard that includes only the essential reports without any unnecessary clutter, puts you in control of your business and of your sales process.
In your customized sales dashboard, you can simply show which resources are bringing revenue, which salesperson is making sales, which product is the best seller, where new opportunities may lie, where your leads are within the sales pipeline, sales forecasts, and more.”
–Rajat Arora, VP-Growth, LeadSquared
It’s the key to unlocking actionable data, optimizing processes, and fostering growth in today’s competitive market. Let’s understand how to do this.
Now that you know how to determine the correct sales metrics, let’s review the most popular ones and how to calculate them.
Now that you know how to determine the correct sales metrics, let’s review the most popular ones and how to calculate them.


Crafting the ideal sales dashboard is a game-changer that unlocks numerous advantages.
Teams gain a data-driven edge, making quicker decisions fueled by actionable insights. Sales processes become smoother, strategies get sharper, and teams align seamlessly toward shared goals.
The outcome?
Improved sales performance, more efficient operations, and a competitive edge that keeps your business ahead in the race.
To achieve all of this, the most important requirement is to utilize a comprehensive tool for the same.
“Sales leaders who are part of Go-To-Market teams have realized that just having access to location, employee size and industry data is simply not enough to really activate their Go-To-Market strategies. This is why the winning sales teams use first-party, second-party and third-party data to create a 360-degree view of their prospects and customers. What is key here, is not just having the data to view in a dashboard but inside their CRM that allows them to turn insights into action at a moment’s notice.”
– Chantelle Fraser, VP-Sales (Africa), LeadSquared
Let’s explore one tool which does the same.
LeadSquared offers an all-encompassing CRM tool for sales dashboards, integrating indispensable functionalities to streamline sales processes and bolster customer relationships.
This platform not only centralizes sales operations but also provides robust sales and marketing automation features.
LeadSquared features an intuitive interface, enabling businesses to easily manage leads, automate repetitive tasks, and streamline sales and marketing workflows.
This results in enhanced customer engagement and facilitates business growth through efficient processes and automation capabilities.
Let’s take a look at some of them:
For example, LeadSquared’s reports allow a more fine-grained control over visibility and empower your team with precise report access control. LeadSquared’s reports allow you to:
Unlock the full potential of your business by leveraging the capabilities of a customized sales dashboard. Elevate your sales performance and operational efficiency to outshine the competition. It’s not just about data; it’s about steering your business towards continuous growth and lasting success.
Curious about how it works?
Book a personalized demo with us today to explore the insights and strategies that can fuel your business growth journey.
In summary, sales dashboards are more than just data displays; they’re powerful tools guiding businesses towards success.
These tools offer a panoramic view of critical metrics, serving as guides for informed decision-making. Their intuitive layouts, visual aids, and adaptability streamline operations fine-tune strategies and amplify sales outcomes.
Ultimately, they embody more than just metrics; they represent the compass steering businesses toward success in today’s dynamic market landscape.
Include key metrics like revenue, conversion rates, lead generation, customer acquisition costs, and sales pipeline data to track and optimize sales performance effectively.
How do I calculate the cost of goods sold on my dashboard?
Use a formula—starting inventory plus purchases, minus ending inventory—to calculate COGS. Display this figure on your dashboard to track expenses directly impacting profitability.
Cost of Goods Sold(COGS) = Beginning Inventory + Purchased Inventory – Ending Inventory
LeadSquared stands out as a top tool for crafting sales dashboards. It offers customizable dashboards, easy data integration, versatile metrics, and a user-friendly interface. Ideal for businesses of all sizes, LeadSquared allows users to tailor dashboards to their specific sales metrics and objectives.
Enter your details and we'll send you a quick confirmation email to verify your address.


 Tired of Battling for Budget?